The mixer atlasEl atlas de los mixers
Every hybrid attention pair, ablation and task in the second experiment round — measured, crossed and charted.Cada par híbrido de atención, ablación y tarea de la segunda tanda de experimentos — medidos, cruzados y graficados.
attn_A__B pairs (667 unique)pares híbridos attn_A__B (667 únicos)Executive summaryResumen ejecutivo
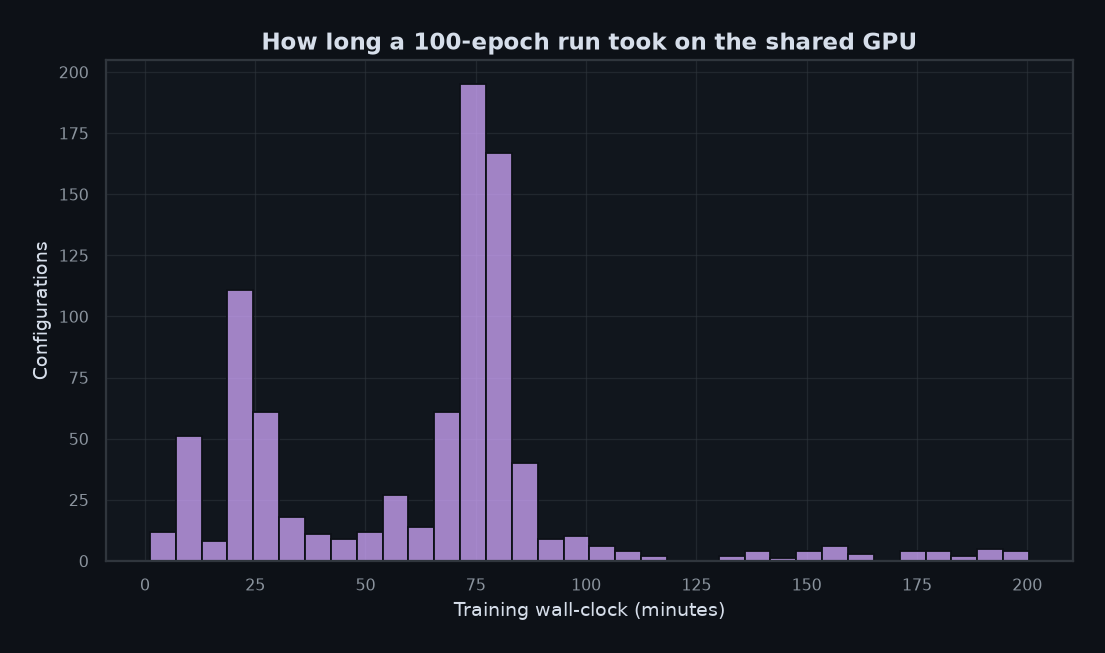
Experiment 2 trained, deployed and evaluated 868 configurations of the Frankenstein Transformer: 703 hybrid-pair records (667 unique pairs after de-duplicating the retnet alias, each combining a first mixer A and a second mixer B as layers 0 and 1), 38 single-mixer baselines, 48 vision transformers and 79 ablations of optimizers, normalizations, positional encodings, structural switches, tokenizers, batch sizes and tasks. Every run trained for 100 epochs (≈3,000 steps) on a 512-token Spanish vocabulary, was exported twice (standard and post-training quantized) and answered four held-out masked-language-modelling prompts.El Experimento 2 entrenó, desplegó y evaluó 868 configuraciones del Frankenstein Transformer: 703 registros de pares híbridos (667 pares únicos tras deduplicar el alias retnet, cada uno con un primer mixer A y un segundo mixer B como capas 0 y 1), 38 líneas base de un solo mixer, 48 transformers de visión y 79 ablaciones de optimizadores, normalizaciones, codificaciones posicionales, conmutadores estructurales, tokenizadores, tamaños de lote y tareas. Cada corrida entrenó 100 épocas (≈3.000 pasos) sobre un vocabulario español de 512 tokens, se exportó dos veces (estándar y cuantizada post-entrenamiento) y respondió cuatro consignas de enmascaramiento reservadas.
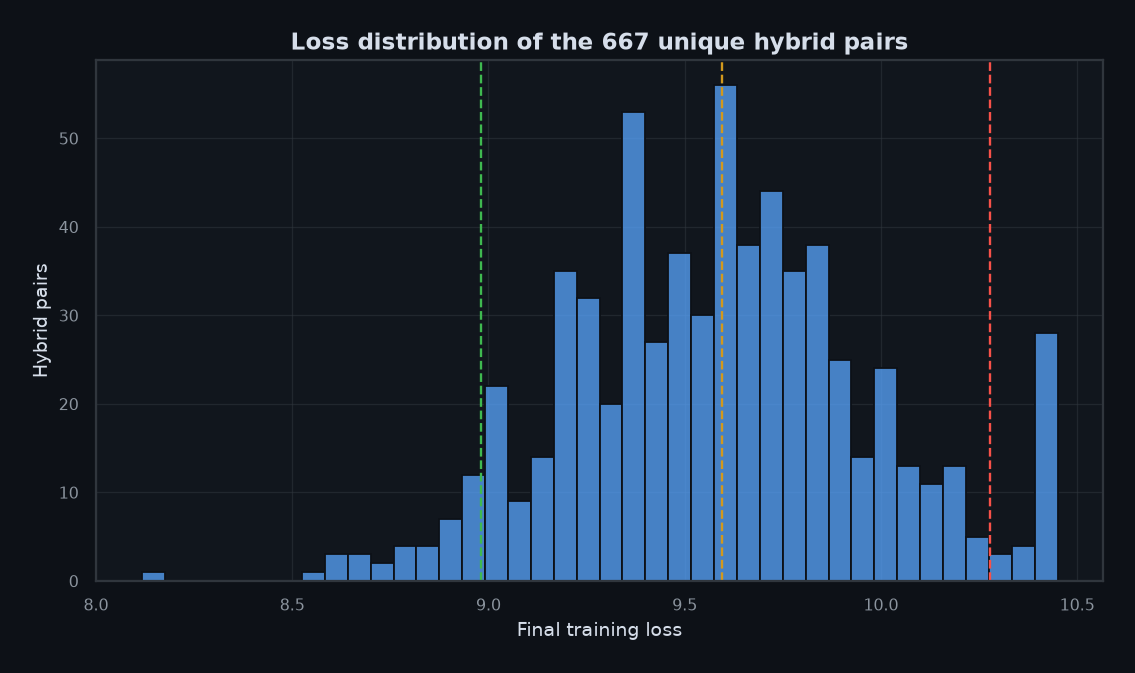
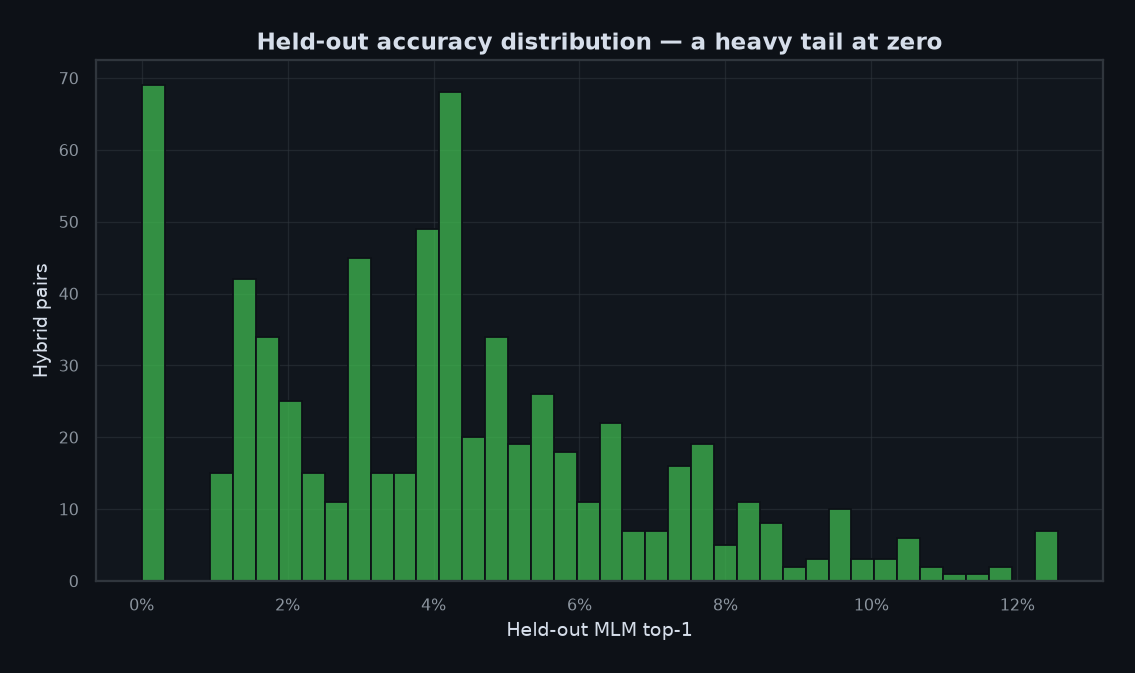
nsa__engram_attn) reaches a final loss of 8.116 nats — 1.479 below the pair median — while fox__falcon1a_attn wins the held-out leaderboard at 12.55%. Post-training quantization is essentially free: 800 of 810 configurations show an identical top-5 hit rate before and after.nsa__engram_attn) alcanza una pérdida final de 8,116 nats — 1,479 por debajo de la mediana de los pares — mientras que fox__falcon1a_attn gana la tabla de validación con 12,55 %. La cuantización post-entrenamiento es prácticamente gratis: 800 de 810 configuraciones muestran la misma tasa top-5 antes y después.- Architecture matters less than the second mixerLa arquitectura importa menos que el segundo mixer
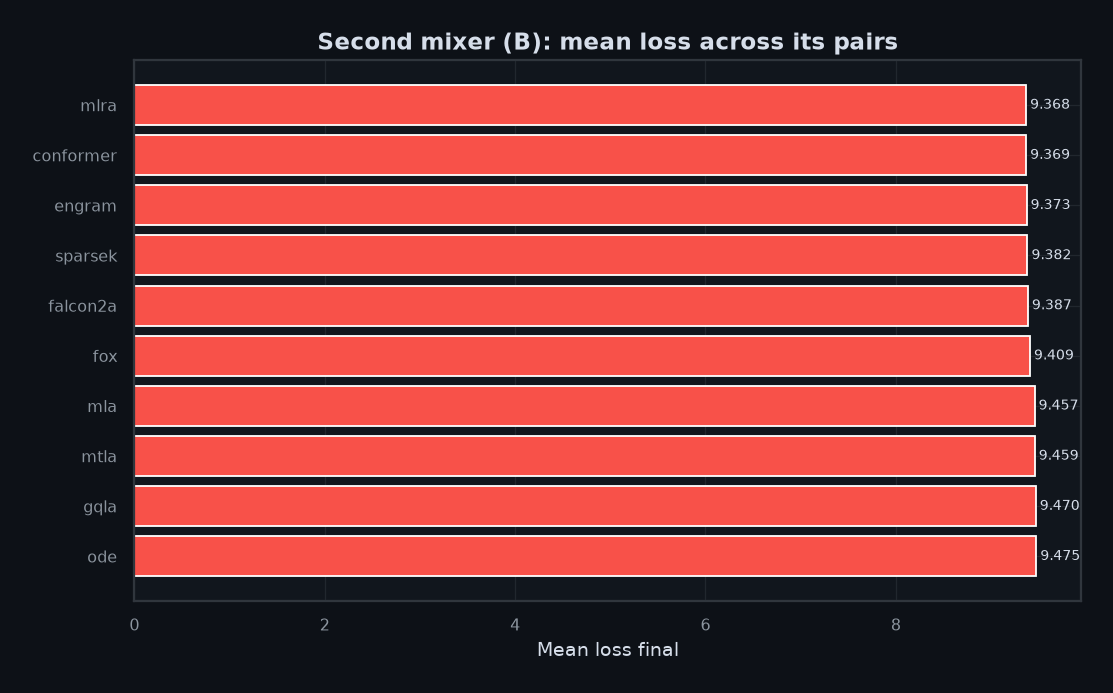
The first mixer explains a narrow band of loss (9.26–9.81 nats between its best and worst family with enough samples), while the second mixer spreads from 9.37 (sparsek) to 10.18 (mamba) — a 0.81-nat gap.El primer mixer explica una banda estrecha de pérdida (9,26–9,81 nats entre su mejor y peor familia con muestras suficientes), mientras que el segundo mixer se abre desde 9,37 (sparsek) hasta 10,18 (mamba) — una brecha de 0,81 nats. - There is real synergy — and real interferenceHay sinergia real — y también interferencia
nsa+engrambeats the average of its two marginal means by 1.304 nats;gqa+tuckerloses 1.018 nats against the same expectation. Pairing is not additive.nsa+engramsupera la media de sus dos marginales en 1,304 nats;gqa+tuckerpierde 1,018 nats frente a esa misma expectativa. Emparejar no es aditivo. - Scale is a weak lever at this sizeLa escala es una palanca débil a este tamaño
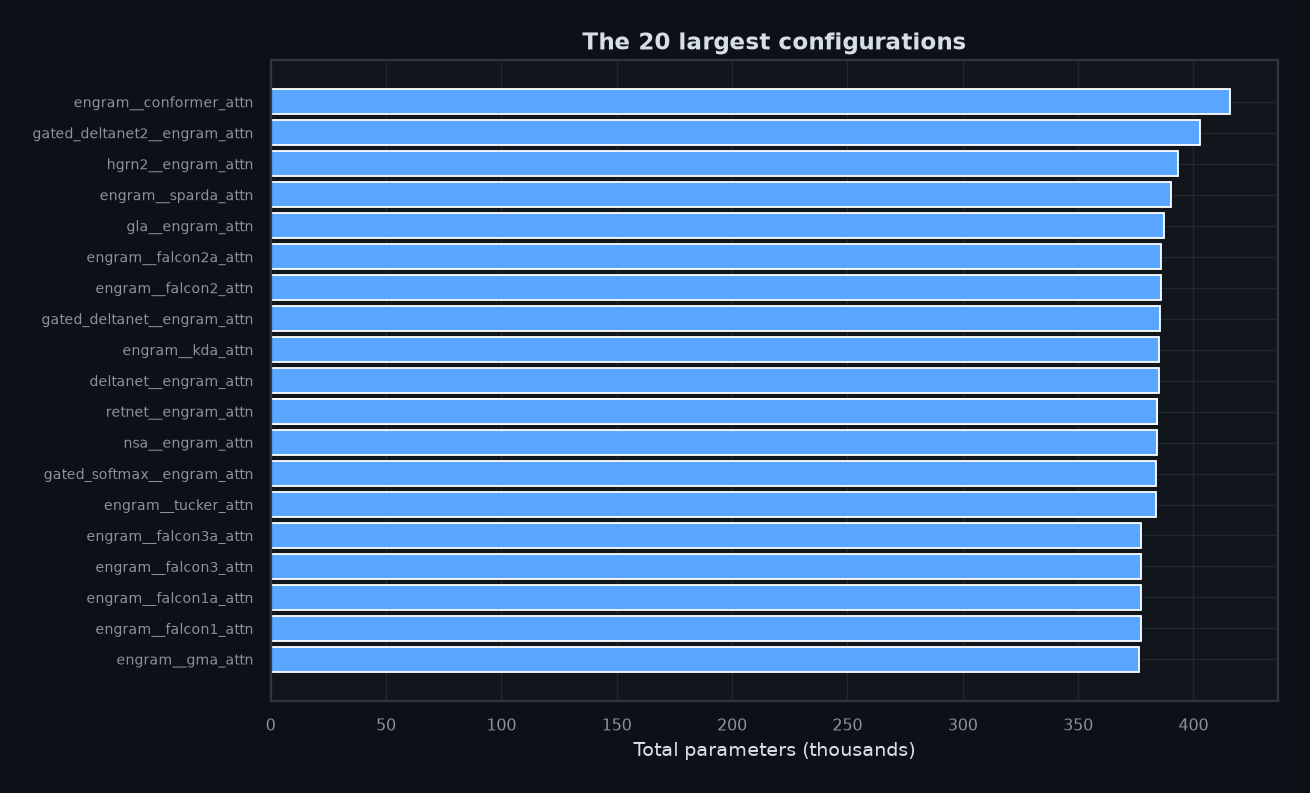
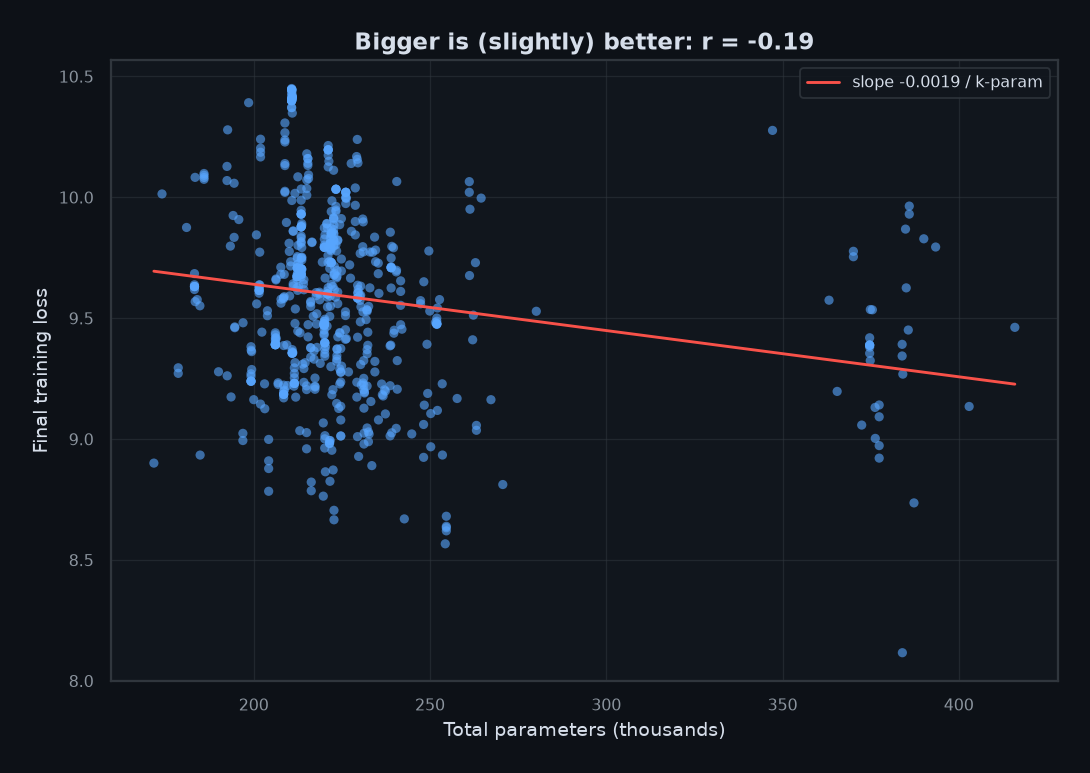
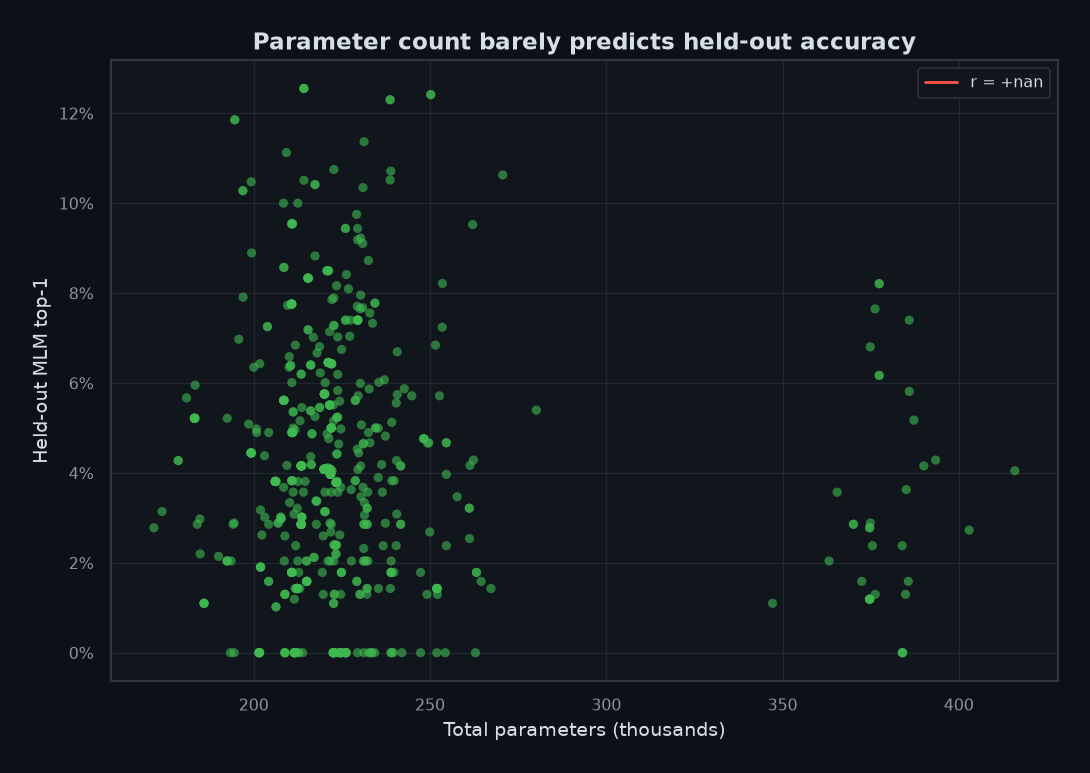
Parameter count correlates with loss at only r = -0.19 and with held-out accuracy at r = -0.07; the largest model (engram__conformer_attn, 415,904 params) is not the best.El número de parámetros correlaciona con la pérdida solo r = -0,19 y con la precisión de validación r = -0,07; el modelo más grande (engram__conformer_attn, 415.904 parámetros) no es el mejor. - Quantization is free, deployment is not fasterLa cuantización es gratis, el despliegue no es más rápido
Top-1 changes by -0.0019 and top-5 by -0.0012 on average, yet quantized deployment is faster in only 32.3% of runs (median speed-up 0.64×) because conversion dominates the 18 s median deploy time.El top-1 cambia -0,0019 y el top-5 -0,0012 de media, pero el despliegue cuantizado solo es más rápido en 32,3 % de las corridas (aceleración mediana 0,64×) porque la conversión domina los 18 s de despliegue. - Four mixers collapse at 32-token sequencesCuatro mixers colapsan con secuencias de 32 tokens
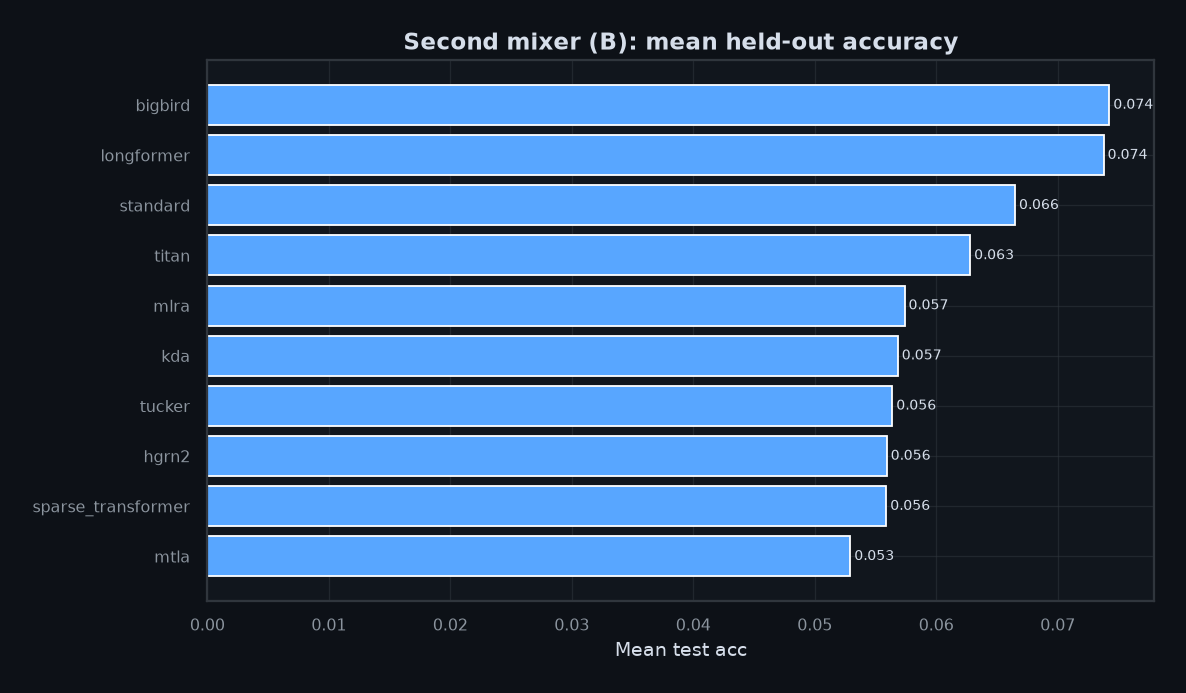
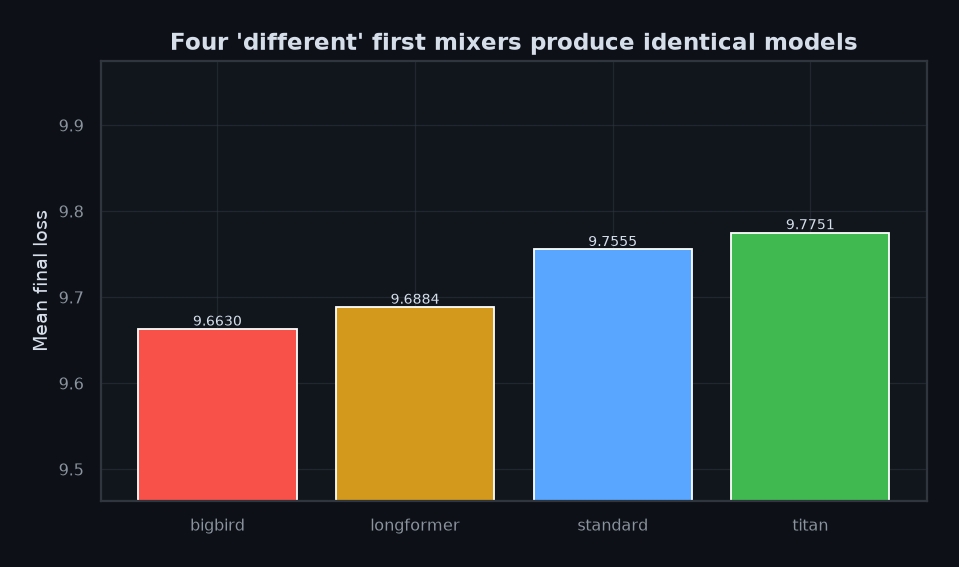
standard,bigbird,longformerandtitanproduce bit-identical losses on 33 of 33 shared second mixers: the sweep trains on 32-token sequences, so windowed sparse attention degenerates to full attention and the PE-augmented variant matches plain MHA. The mixer list needs a longer-context pass.standard,bigbird,longformerytitanproducen pérdidas bit a bit idénticas en 33 de 33 segundos mixers compartidos: la tanda entrena con secuencias de 32 tokens, así que la atención dispersa por ventanas degenera en atención completa y la variante con codificación posicional coincide con MHA pura. La lista de mixers necesita una pasada de contexto largo. - The sweep is honest about its failuresLa tanda es honesta con sus fallos
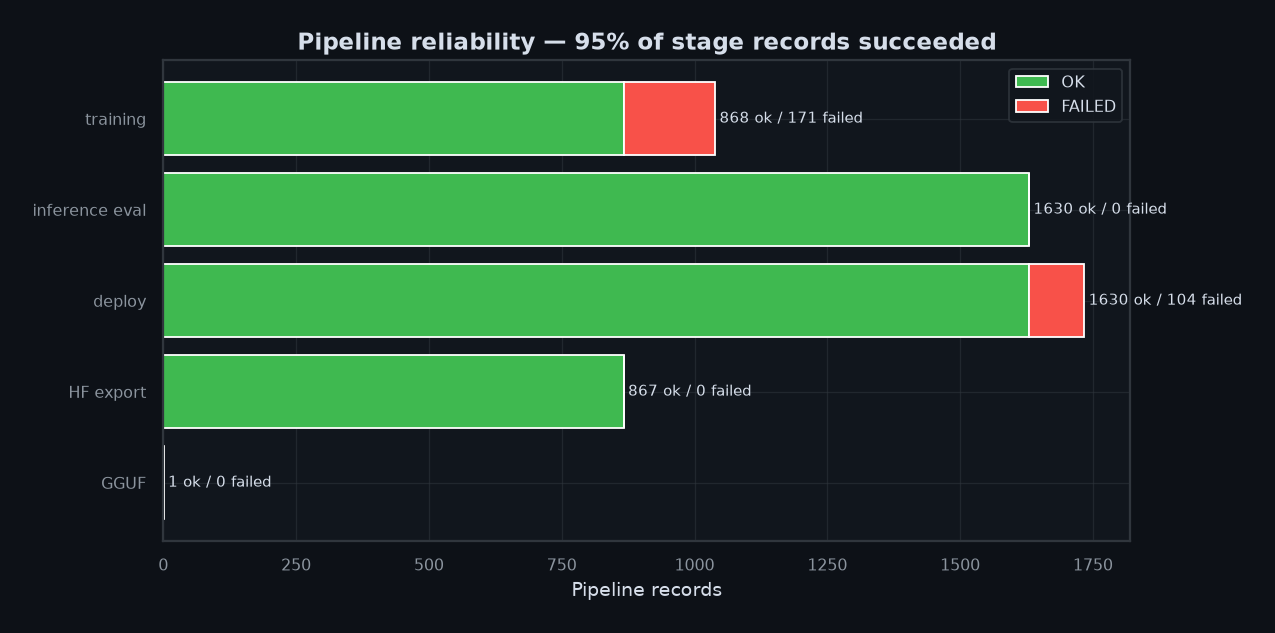
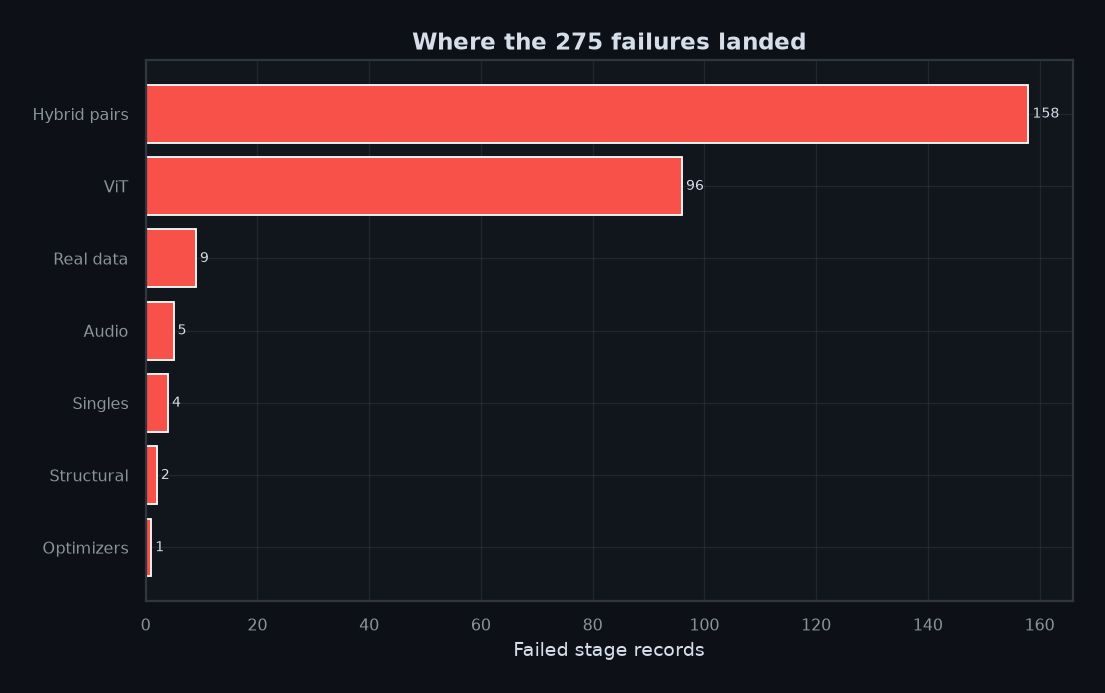
275 of the 5,271 pipeline records failed (171 training runs, 104 deployments), all outside the 868 analysed configurations; the survivors completed 95% of their stages.275 de los 5.271 registros del pipeline fallaron (171 entrenamientos, 104 despliegues), todos fuera de las 868 configuraciones analizadas; las supervivientes completaron el 95% de sus etapas.
What was run, and how to read itQué se corrió y cómo leerlo
Each configuration is identified by a slug such as attn_nsa_attn__engram_attn: the prefix names the family, then first_mixer__second_mixer. Ablations use their own prefixes (opt_, norm_, pe_, trans_, vit_, task_, tokenizer_, batch_). The pipeline is identical for every row: train 100 epochs → export to a standard checkpoint → deploy in standard and quantized formats → evaluate four masked sentences per format → export the Hugging Face package.Cada configuración se identifica con un slug como attn_nsa_attn__engram_attn: el prefijo nombra la familia y luego viene primer_mixer__segundo_mixer. Las ablaciones usan sus propios prefijos (opt_, norm_, pe_, trans_, vit_, task_, tokenizer_, batch_). El pipeline es idéntico para cada fila: entrenar 100 épocas → exportar un checkpoint estándar → desplegar en formato estándar y cuantizado → evaluar cuatro frases enmascaradas por formato → exportar el paquete de Hugging Face.
Hybrid pairs are generated as itertools.combinations(ATTENTIONS, 2) and materialised as dims.layer_pattern: [A, B] with num_layers: 2 — layer 0 runs mixer A and layer 1 runs mixer B. Singles use num_layers: 1. Because the combinations follow the fixed order of the 42-entry mixer list, no reversed pair (B, A) exists: the “first vs second” asymmetry in this report is therefore confounded with list order and must be read as descriptive, not causal.Los pares híbridos se generan con itertools.combinations(ATTENTIONS, 2) y se materializan como dims.layer_pattern: [A, B] con num_layers: 2 — la capa 0 ejecuta el mixer A y la capa 1 el mixer B. Los singles usan num_layers: 1. Como las combinaciones siguen el orden fijo de la lista de 42 mixers, no existe ningún par invertido (B, A): la asimetría “primero vs segundo” de este informe está confundida con el orden de la lista y debe leerse como descriptiva, no causal.
The data comes from three independent recorders: a per-step training log (2.66 M rows), a parameter census of every module group and a results ledger of the five pipeline stages. This report joins all three by configuration; the per-step log is streamed and aggregated to per-epoch means so that every chart remains reproducible on a laptop.Los datos provienen de tres registradores independientes: un log de entrenamiento paso a paso (2,66 M de filas), un censo de parámetros por grupo de módulos y un libro de resultados de las cinco etapas del pipeline. Este informe une los tres por configuración; el log paso a paso se procesa en streaming y se agrega a medias por época para que todos los gráficos sigan siendo reproducibles en un portátil.
| Family | Configs | Median params | Median loss | Median score | Median tok/s | Median min |
|---|---|---|---|---|---|---|
| pair | 703 | 220,928 | 9.591 | 4.08% | 356 | 75.3 |
| vit | 48 | 315,694 | 1.205 | 75.97% | 23 | 9.4 |
| single | 38 | 157,584 | 9.762 | 3.57% | 366 | 24.8 |
| opt | 23 | 210,752 | 10.404 | 7.76% | 391 | 21.2 |
| trans | 20 | 210,752 | 10.397 | 5.71% | 387 | 21.2 |
| pe | 12 | 210,752 | 10.381 | 7.76% | 402 | 21.9 |
| realdata | 6 | 247,788 | 1.060 | 39.04% | 392 | 7.6 |
| norm | 6 | 210,512 | 10.348 | 1.61% | 407 | 20.7 |
| tokenizer | 4 | 210,752 | 5.978 | 4.37% | 4,202 | 1.1 |
| task | 4 | 210,752 | 8.603 | 5.90% | 457 | 19.4 |
| batch | 2 | 210,752 | 10.368 | 5.40% | 596 | 13.0 |
| bitnet | 1 | 209,856 | 10.369 | — | 562 | — |
| audio | 1 | 147,171 | 1.099 | 0.00% | 31,082 | 1.2 |
| Familia | Configs | Parámetros mediana | Pérdida mediana | Métrica mediana | tok/s mediana | Min mediana |
|---|---|---|---|---|---|---|
| pair | 703 | 220,928 | 9.591 | 4.08% | 356 | 75.3 |
| vit | 48 | 315,694 | 1.205 | 75.97% | 23 | 9.4 |
| single | 38 | 157,584 | 9.762 | 3.57% | 366 | 24.8 |
| opt | 23 | 210,752 | 10.404 | 7.76% | 391 | 21.2 |
| trans | 20 | 210,752 | 10.397 | 5.71% | 387 | 21.2 |
| pe | 12 | 210,752 | 10.381 | 7.76% | 402 | 21.9 |
| realdata | 6 | 247,788 | 1.060 | 39.04% | 392 | 7.6 |
| norm | 6 | 210,512 | 10.348 | 1.61% | 407 | 20.7 |
| tokenizer | 4 | 210,752 | 5.978 | 4.37% | 4,202 | 1.1 |
| task | 4 | 210,752 | 8.603 | 5.90% | 457 | 19.4 |
| batch | 2 | 210,752 | 10.368 | 5.40% | 596 | 13.0 |
| bitnet | 1 | 209,856 | 10.369 | — | 562 | — |
| audio | 1 | 147,171 | 1.099 | 0.00% | 31,082 | 1.2 |
1 · The parameter landscape1 · El paisaje de parámetros
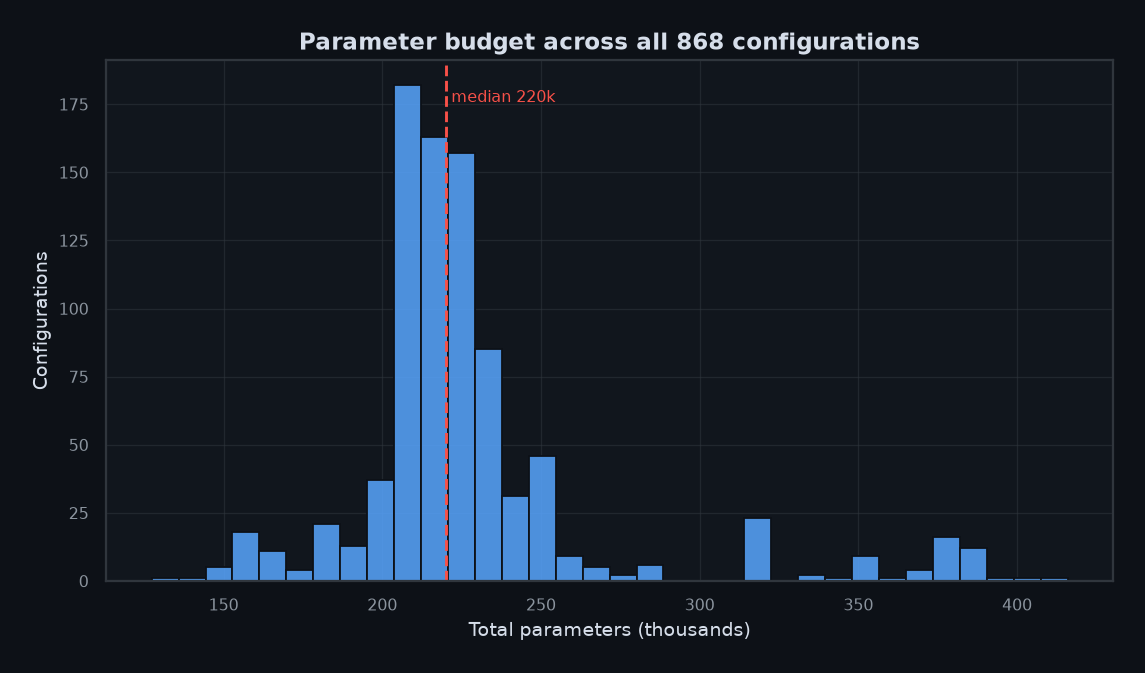
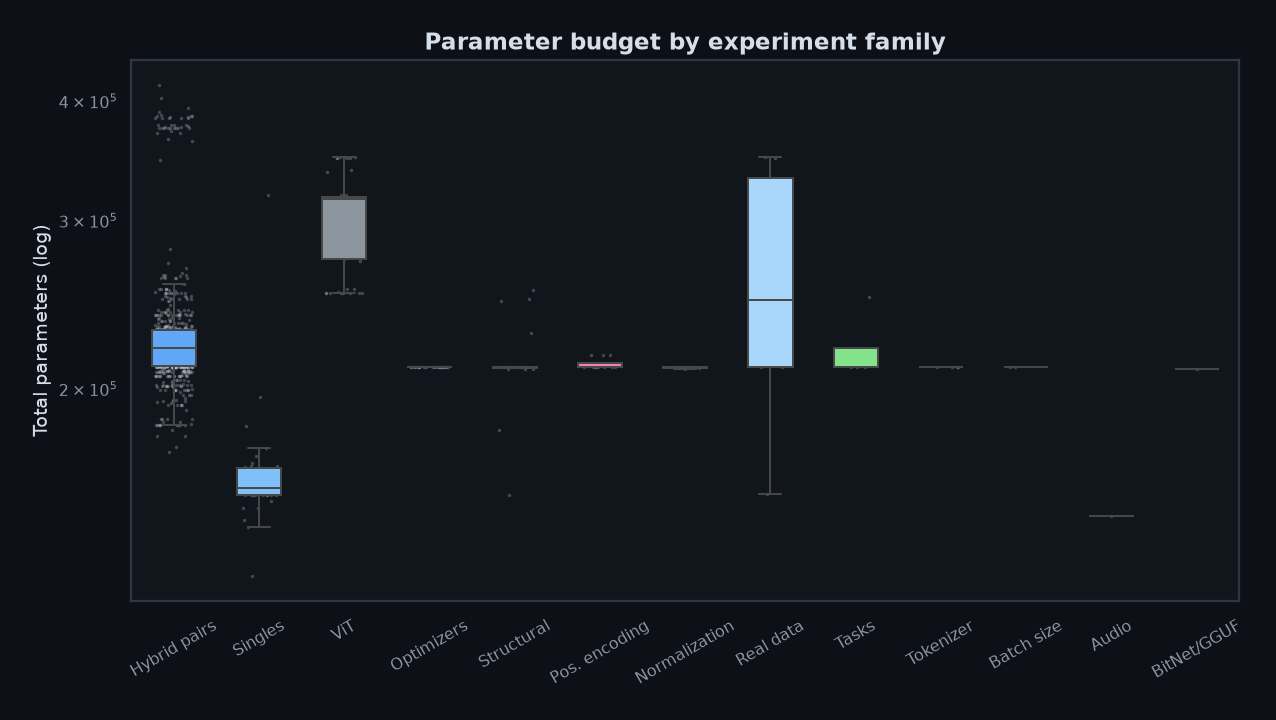
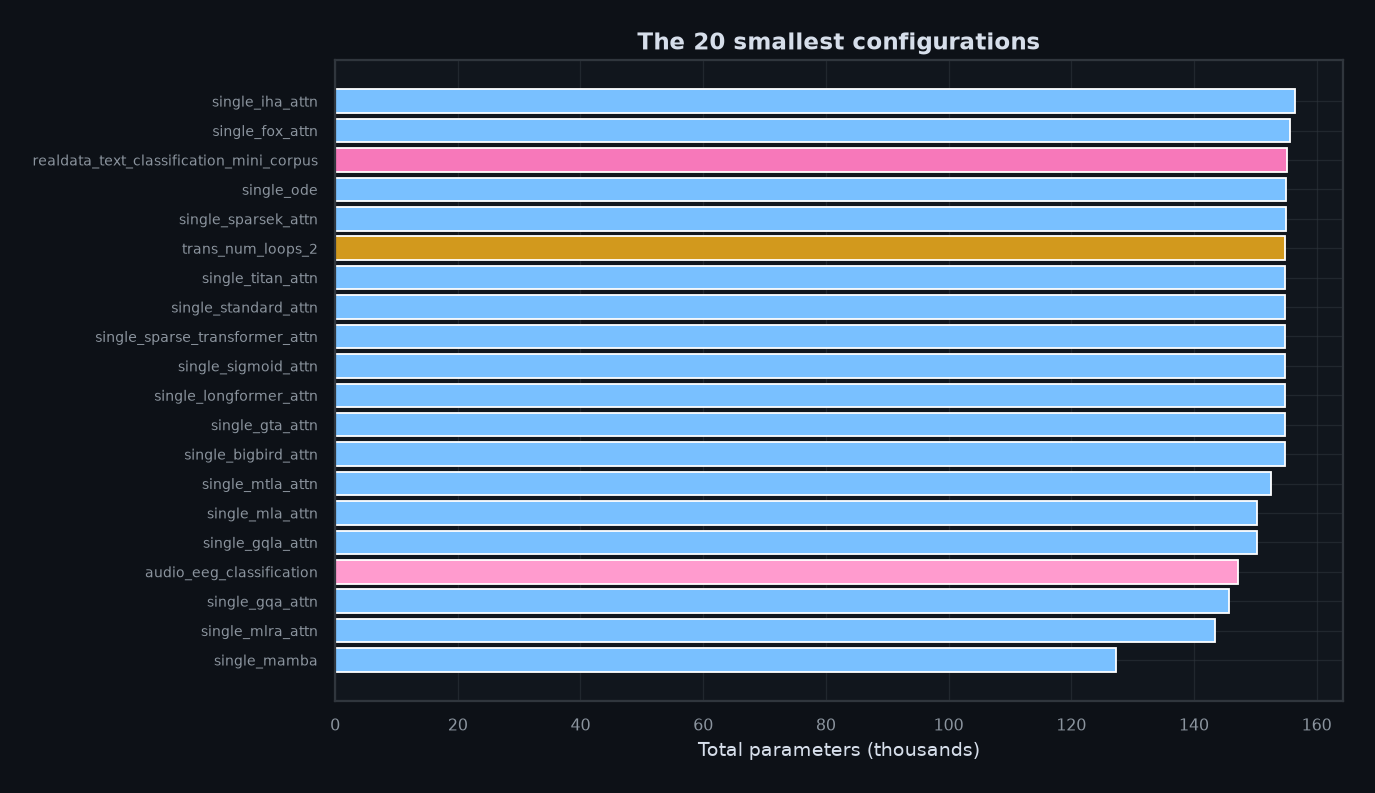
The 868 configurations span 127,328 to 415,904 parameters, with a median of 220,160. The hybrid pairs sit in the middle of the range because they combine two attention modules; the smallest runs are single-mixer baselines such as attn_single_mamba (127,328 parameters), and the largest is engram__conformer_attn at 415,904 — driven by its engram memory bank, which adds a large key-value table to the attention block.Las 868 configuraciones abarcan de 127.328 a 415.904 parámetros, con una mediana de 220.160. Los pares híbridos ocupan el centro del rango porque combinan dos módulos de atención; las corridas más pequeñas son líneas base de un solo mixer como attn_single_mamba (127.328 parámetros), y la mayor es engram__conformer_attn con 415.904 — impulsada por su banco de memoria engram, que añade una gran tabla clave-valor al bloque de atención.
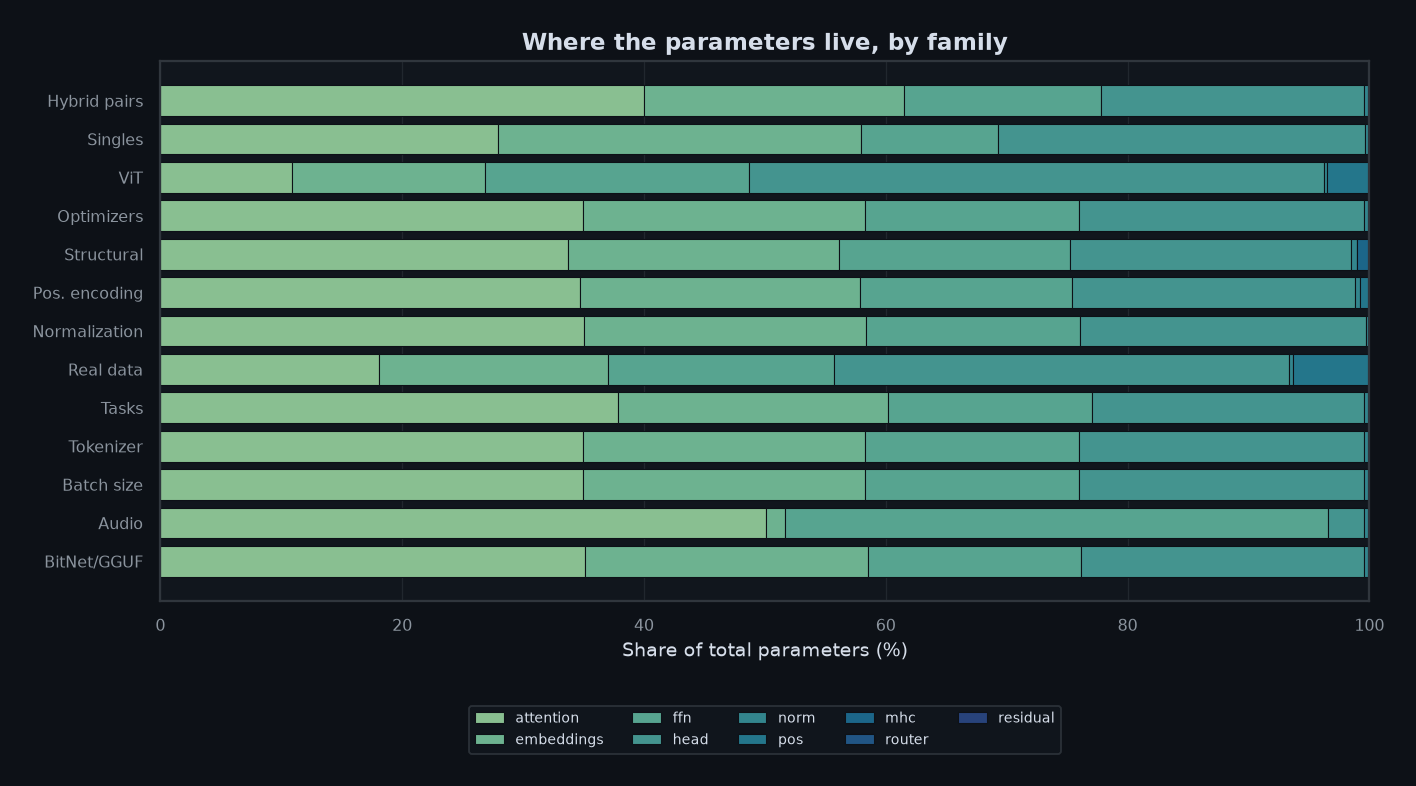
The composition chart is the most useful diagnostic in this section: embeddings and the output head are fixed costs (about 49k parameters each), so any difference between configurations is almost entirely paid by the attention block and the FFN. The vision transformers are the most parameter-hungry family because they add patch embeddings and a larger classification head, while ablations of optimizer, normalization or positional encoding keep the same 210k-parameter backbone by design.El gráfico de composición es el diagnóstico más útil de esta sección: los embeddings y la cabeza de salida son costes fijos (unos 49k parámetros cada uno), así que cualquier diferencia entre configuraciones se paga casi por completo en el bloque de atención y la FFN. Los transformers de visión son la familia más costosa porque añaden embeddings de parches y una cabeza de clasificación mayor, mientras que las ablaciones de optimizador, normalización o codificación posicional mantienen por diseño el mismo esqueleto de 210k parámetros.
2 · Training outcomes2 · Resultados de entrenamiento
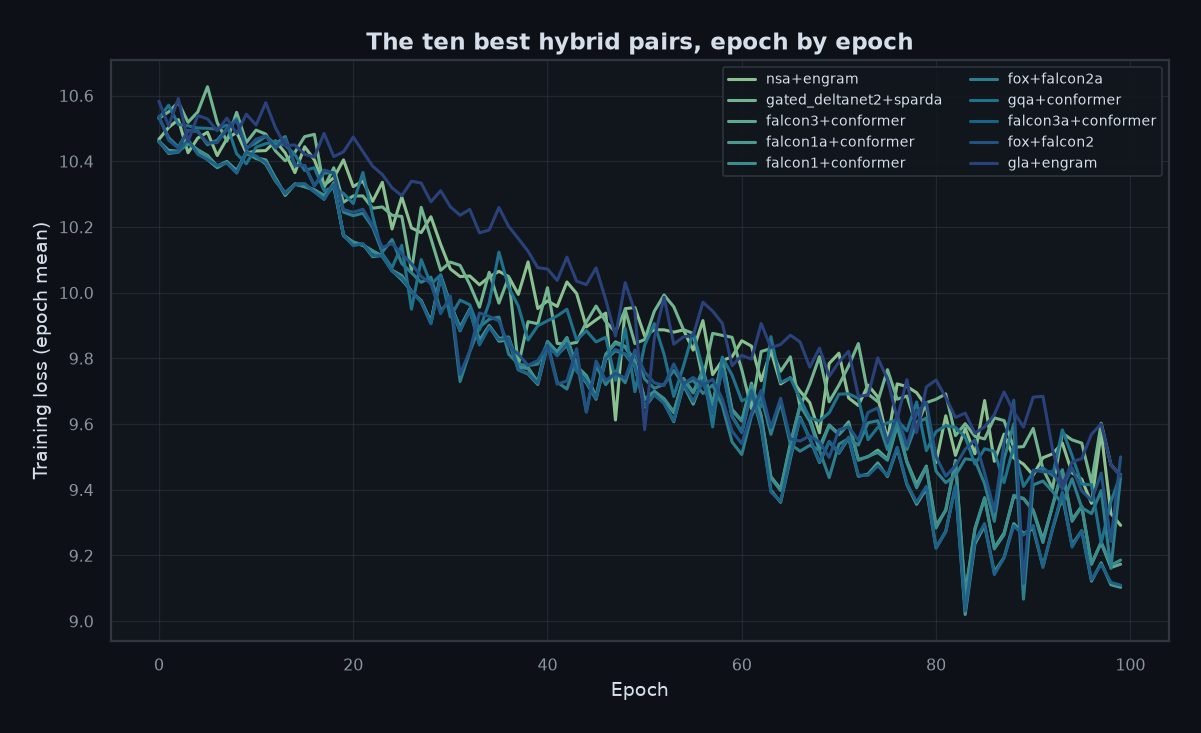
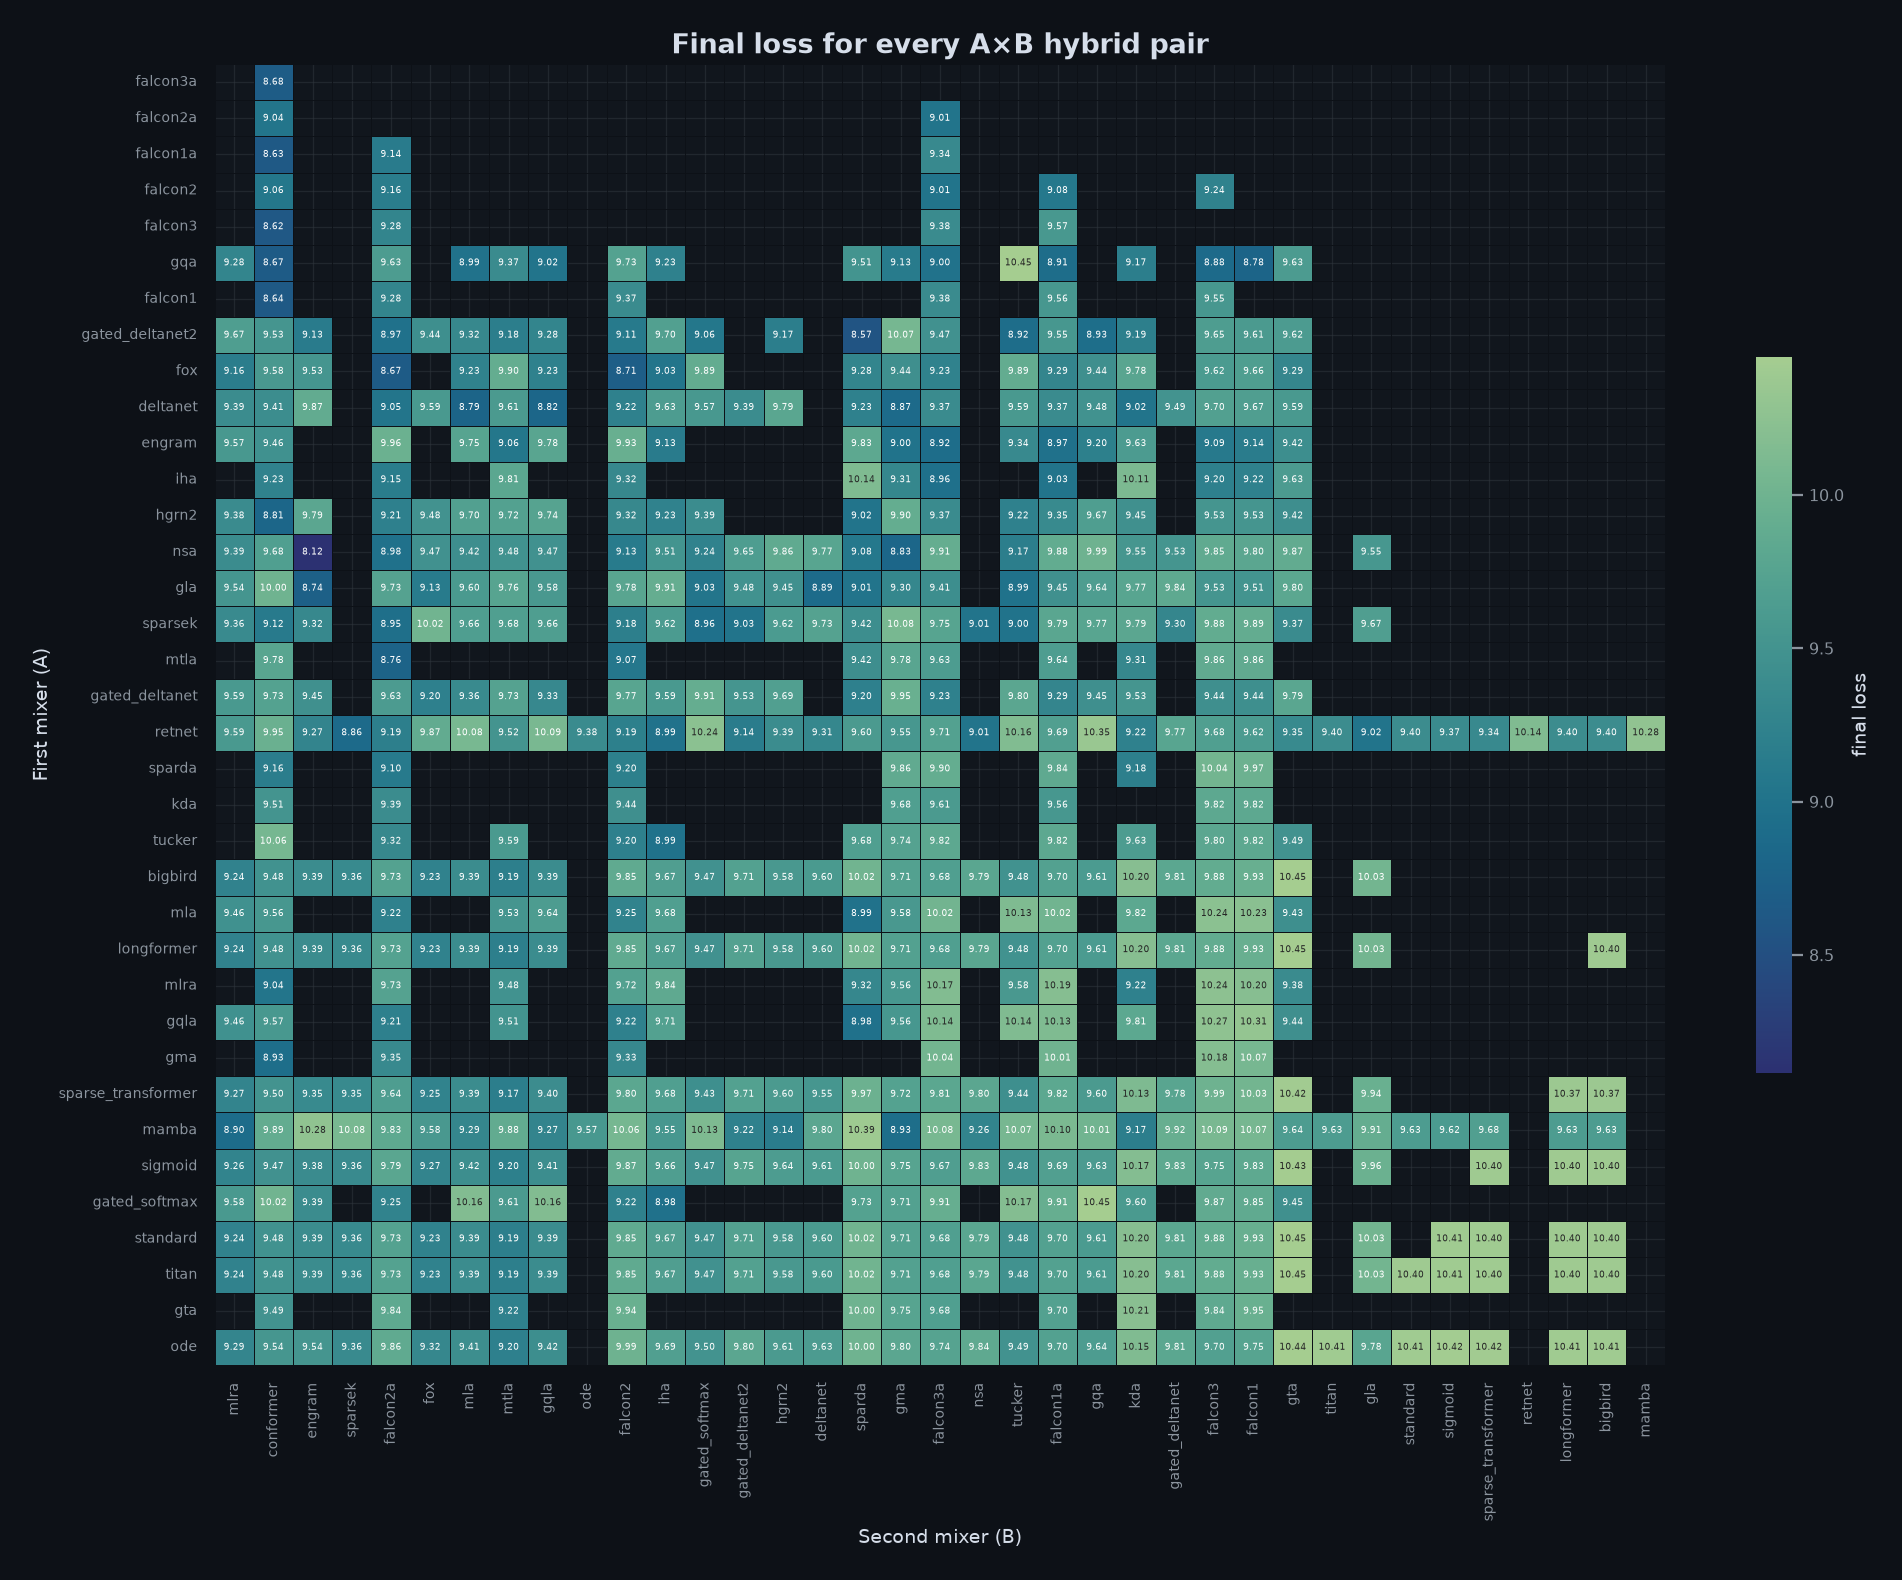
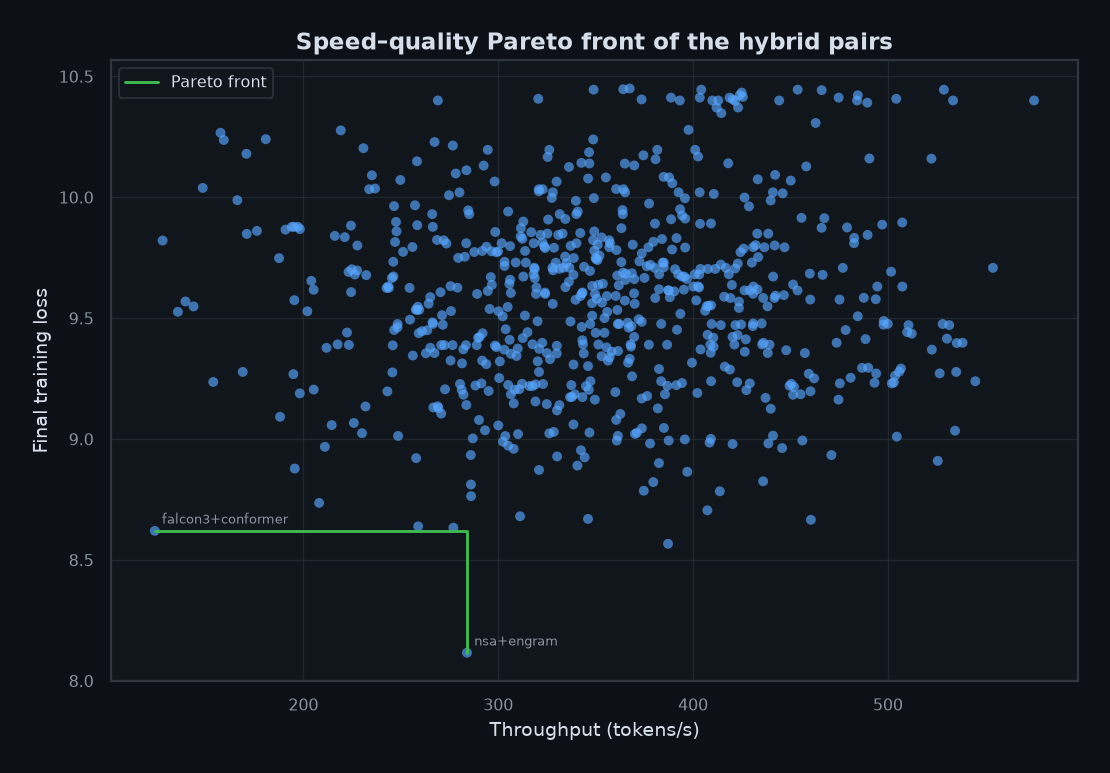
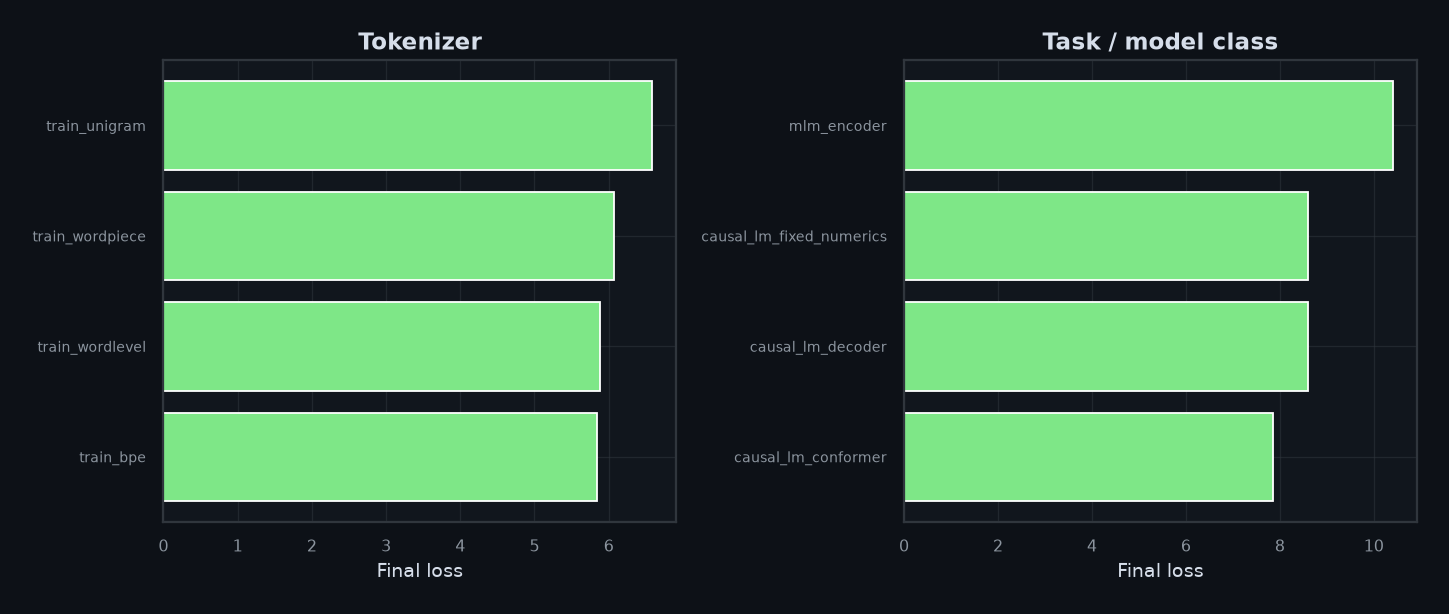
Across the hybrid pairs, final loss ranges from 8.116 to 10.450 nats (median 9.595). The best hybrid pair is nsa__engram_attn at 8.116, followed by gated_deltanet2__sparda_attn (8.567) and fox__falcon2_attn (8.705). The worst pair, gqa__tucker_attn, needs 10.450 nats — the spread between the extremes is larger than the spread between most optimizer ablations, which is the strongest argument for mixing the right attention pair.Entre los pares híbridos, la pérdida final va de 8,116 a 10,450 nats (mediana 9,595). El mejor par híbrido es nsa__engram_attn con 8,116, seguido de gated_deltanet2__sparda_attn (8,567) y fox__falcon2_attn (8,705). El peor par, gqa__tucker_attn, necesita 10,450 nats — la brecha entre extremos supera la brecha entre casi todas las ablaciones de optimizadores, y ese es el argumento más fuerte para elegir bien el par de atención.
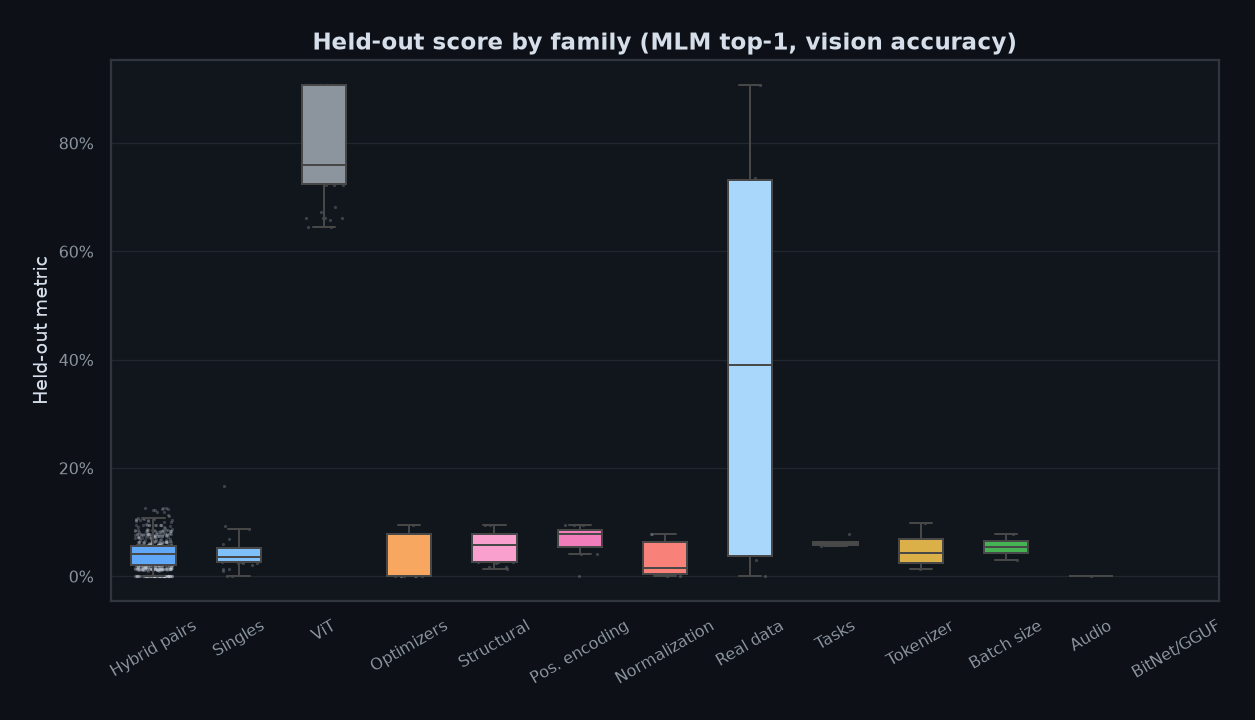
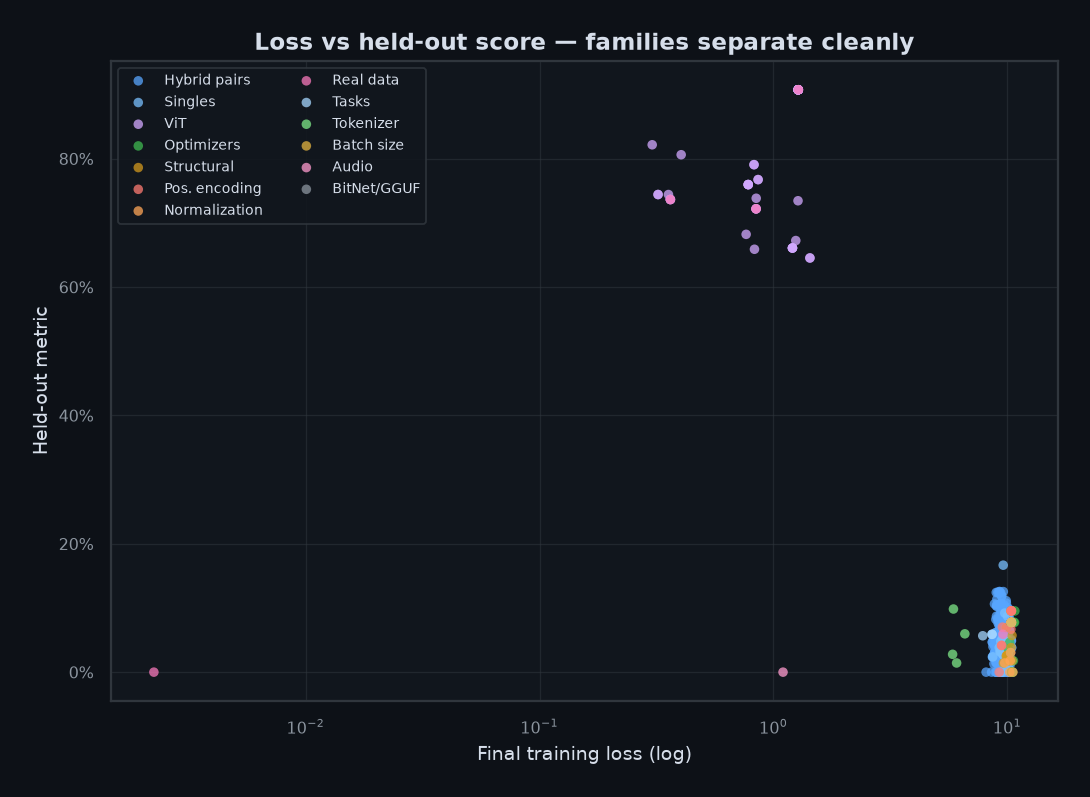
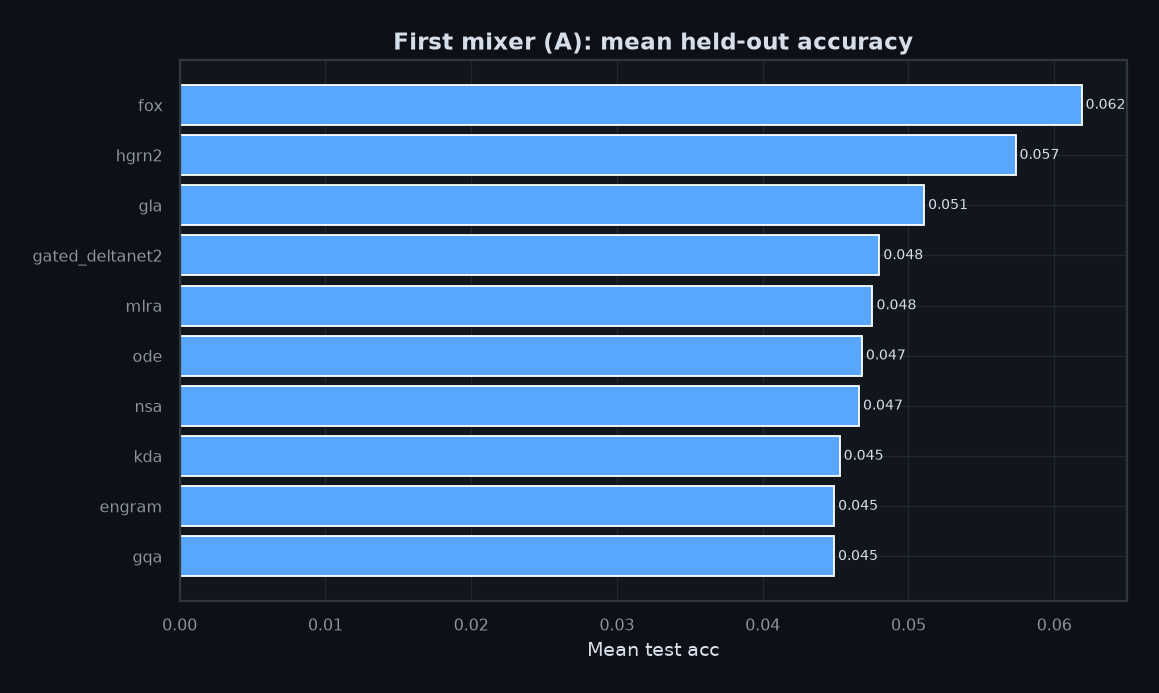
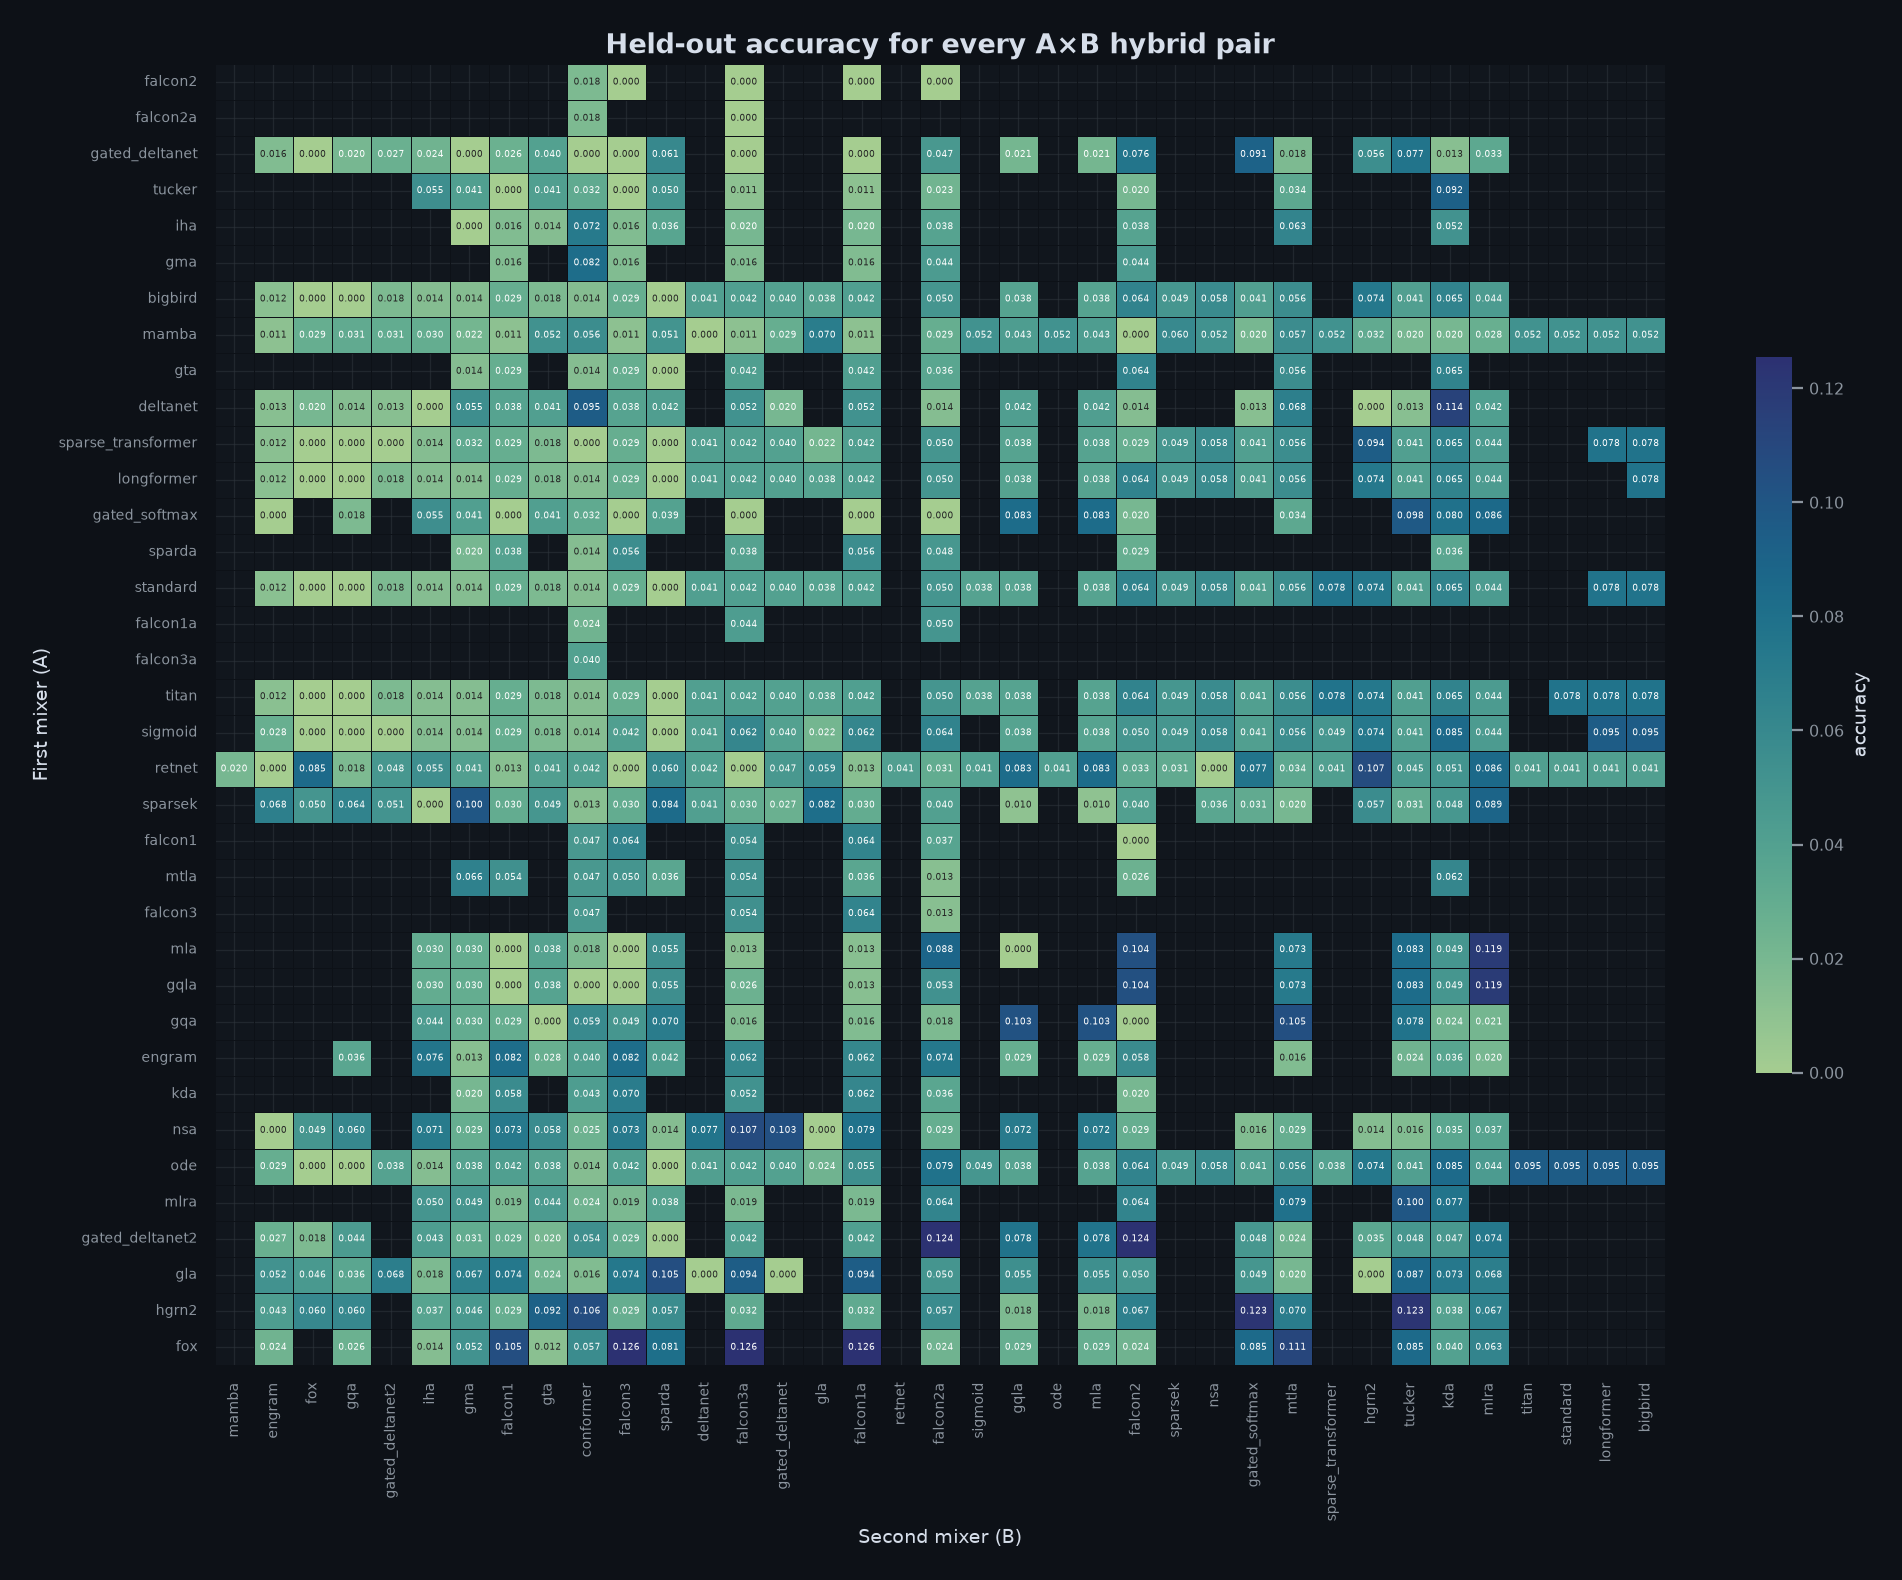
fox__falcon1a_attn) reaches 12.55% with a worse training loss (9.29). With four evaluation sentences, one lucky token rewrites the ranking — always report both signals.fox__falcon1a_attn) alcanza 12,55 % con una pérdida de entrenamiento peor (9,29). Con cuatro frases de evaluación, un token afortunado reescribe el ranking — hay que reportar ambas señales.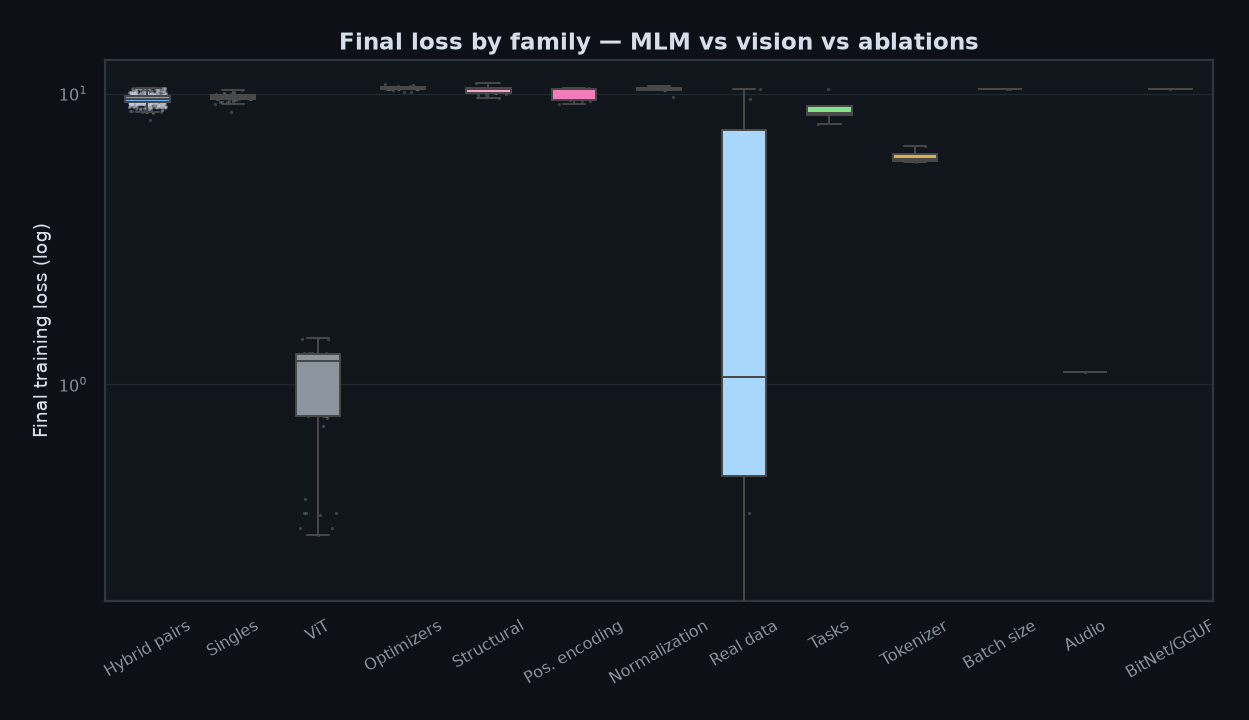
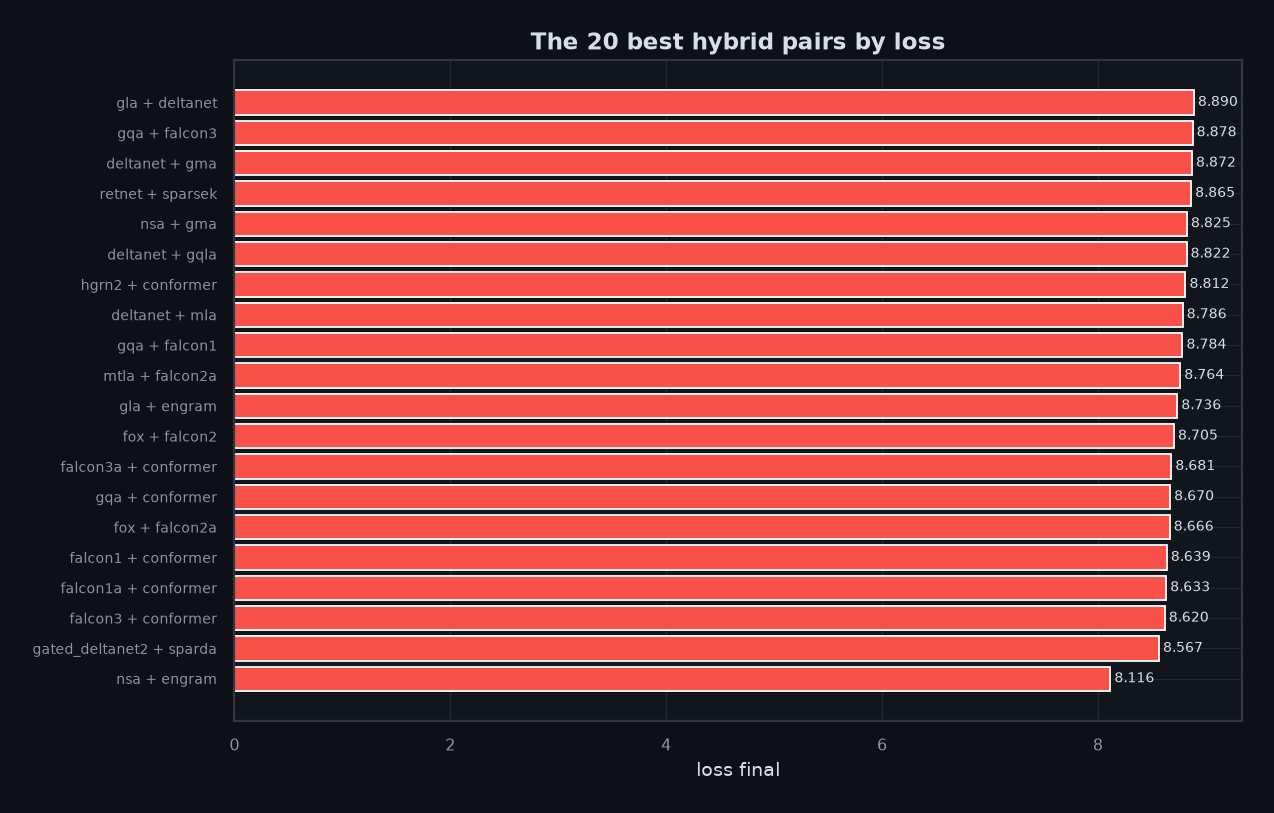
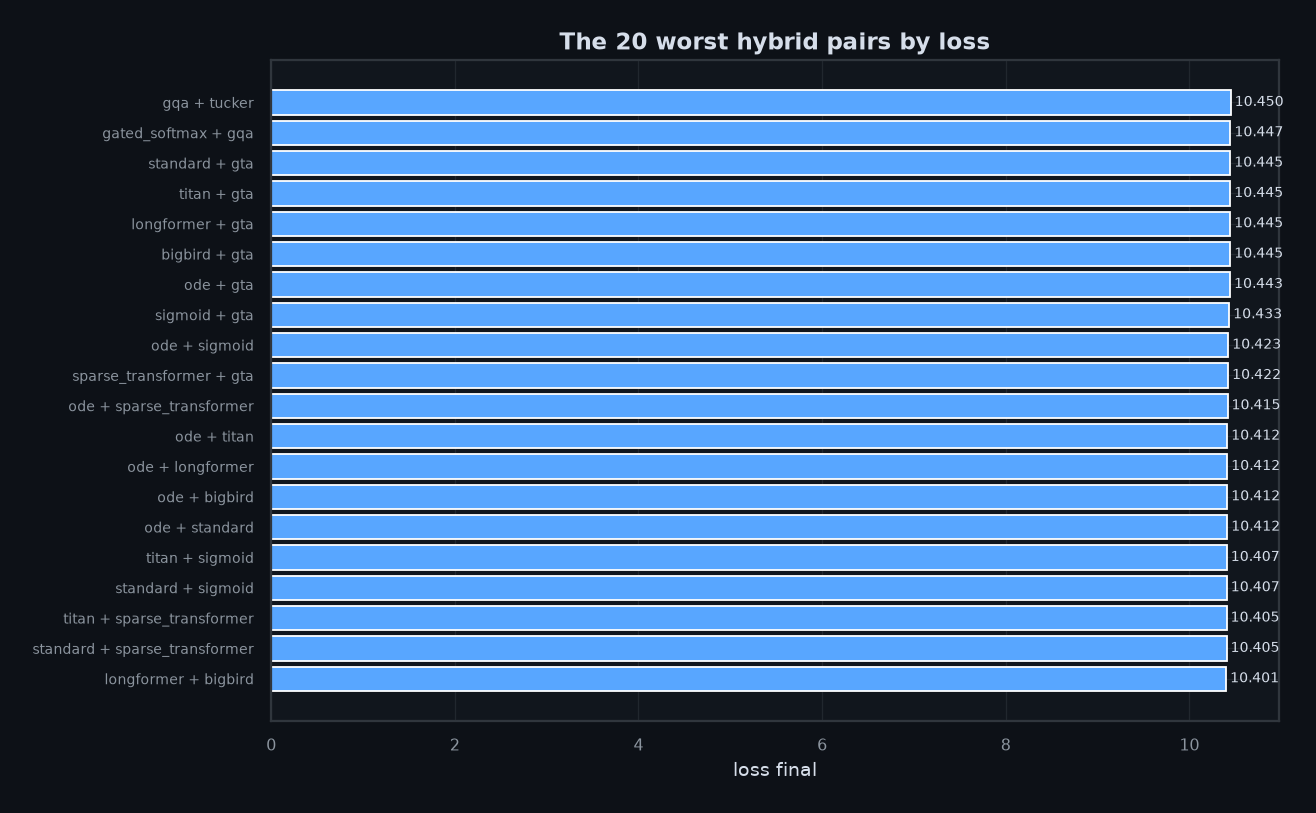
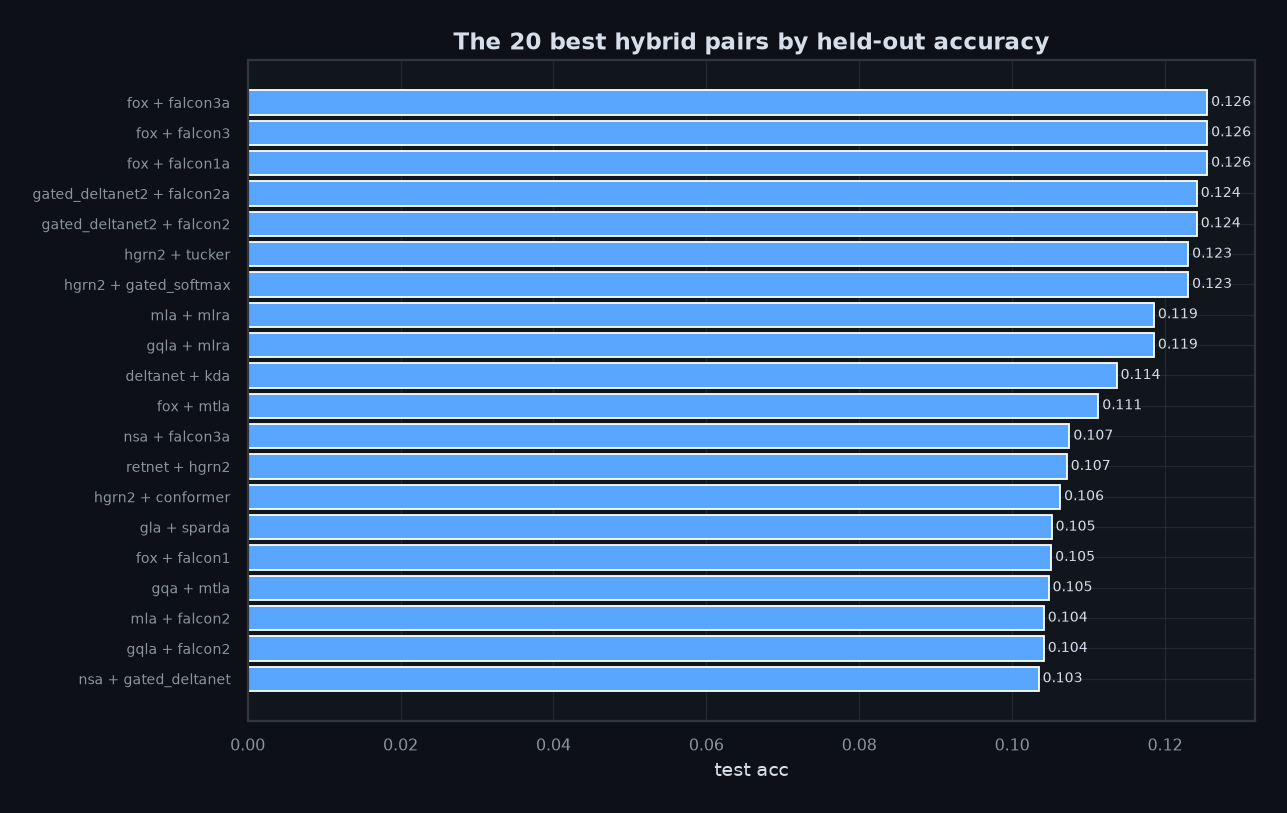
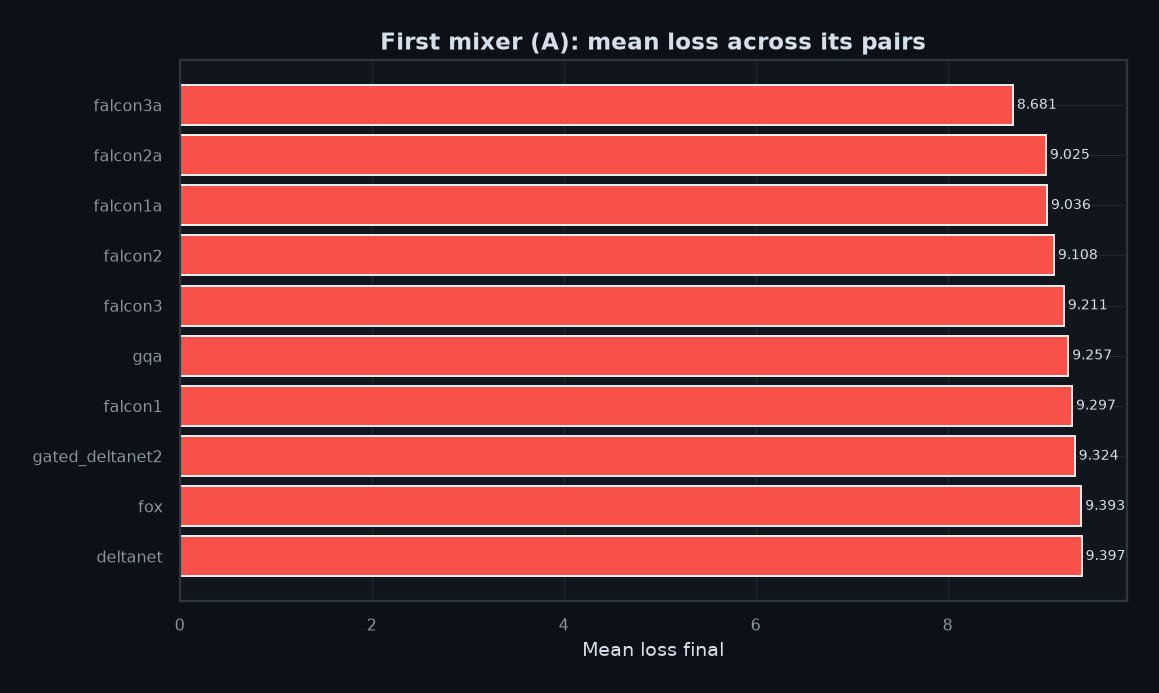
Top 20 hybrid pairs by final lossTop 20 de pares híbridos por pérdida final
| Pair (A + B) | Params | Final loss | Top-1 | Top-5 | Tok/s | Train (min) |
|---|---|---|---|---|---|---|
| nsa__engram_attn | 383,999 | 8.116 | 0.00% | 25.0% | 284 | 154.5 |
| gated_deltanet2__sparda_attn | 254,336 | 8.567 | 0.00% | 25.0% | 387 | 78.2 |
| falcon3__conformer_attn | 254,640 | 8.620 | 4.67% | 25.0% | 124 | 32.6 |
| falcon1a__conformer_attn | 254,640 | 8.633 | 2.38% | 25.0% | 277 | 23.0 |
| falcon1__conformer_attn | 254,640 | 8.639 | 4.67% | 25.0% | 259 | 21.3 |
| fox__falcon2a_attn | 222,768 | 8.666 | 2.40% | 25.0% | 460 | 84.2 |
| gqa__conformer_attn | 242,720 | 8.670 | 5.87% | 25.0% | 346 | 88.3 |
| falcon3a__conformer_attn | 254,640 | 8.681 | 3.97% | 25.0% | 311 | 23.2 |
| fox__falcon2_attn | 222,768 | 8.705 | 2.40% | 25.0% | 407 | 85.8 |
| gla__engram_attn | 387,296 | 8.736 | 5.17% | 25.0% | 208 | 149.2 |
| mtla__falcon2a_attn | 219,736 | 8.764 | 1.30% | 0.0% | 286 | 23.8 |
| gqa__falcon1_attn | 204,240 | 8.784 | 2.86% | 0.0% | 414 | 85.5 |
| deltanet__mla_attn | 216,320 | 8.786 | 4.18% | 0.0% | 375 | 80.1 |
| hgrn2__conformer_attn | 270,656 | 8.812 | 10.63% | 0.0% | 286 | 89.2 |
| deltanet__gqla_attn | 216,320 | 8.822 | 4.18% | 0.0% | 380 | 75.5 |
| nsa__gma_attn | 221,631 | 8.825 | 2.88% | 25.0% | 436 | 72.4 |
| retnet__sparsek_attn | 220,329 | 8.865 | 3.14% | 25.0% | 397 | 57.7 |
| deltanet__gma_attn | 222,528 | 8.872 | 5.51% | 0.0% | 321 | 74.1 |
| gqa__falcon3_attn | 204,240 | 8.878 | 4.90% | 0.0% | 196 | 112.8 |
| gla__deltanet_attn | 233,504 | 8.890 | 0.00% | 0.0% | 341 | 80.6 |
| Par (A + B) | Parámetros | Pérdida final | Top-1 | Top-5 | Tok/s | Entreno (min) |
|---|---|---|---|---|---|---|
| nsa__engram_attn | 383,999 | 8.116 | 0.00% | 25.0% | 284 | 154.5 |
| gated_deltanet2__sparda_attn | 254,336 | 8.567 | 0.00% | 25.0% | 387 | 78.2 |
| falcon3__conformer_attn | 254,640 | 8.620 | 4.67% | 25.0% | 124 | 32.6 |
| falcon1a__conformer_attn | 254,640 | 8.633 | 2.38% | 25.0% | 277 | 23.0 |
| falcon1__conformer_attn | 254,640 | 8.639 | 4.67% | 25.0% | 259 | 21.3 |
| fox__falcon2a_attn | 222,768 | 8.666 | 2.40% | 25.0% | 460 | 84.2 |
| gqa__conformer_attn | 242,720 | 8.670 | 5.87% | 25.0% | 346 | 88.3 |
| falcon3a__conformer_attn | 254,640 | 8.681 | 3.97% | 25.0% | 311 | 23.2 |
| fox__falcon2_attn | 222,768 | 8.705 | 2.40% | 25.0% | 407 | 85.8 |
| gla__engram_attn | 387,296 | 8.736 | 5.17% | 25.0% | 208 | 149.2 |
| mtla__falcon2a_attn | 219,736 | 8.764 | 1.30% | 0.0% | 286 | 23.8 |
| gqa__falcon1_attn | 204,240 | 8.784 | 2.86% | 0.0% | 414 | 85.5 |
| deltanet__mla_attn | 216,320 | 8.786 | 4.18% | 0.0% | 375 | 80.1 |
| hgrn2__conformer_attn | 270,656 | 8.812 | 10.63% | 0.0% | 286 | 89.2 |
| deltanet__gqla_attn | 216,320 | 8.822 | 4.18% | 0.0% | 380 | 75.5 |
| nsa__gma_attn | 221,631 | 8.825 | 2.88% | 25.0% | 436 | 72.4 |
| retnet__sparsek_attn | 220,329 | 8.865 | 3.14% | 25.0% | 397 | 57.7 |
| deltanet__gma_attn | 222,528 | 8.872 | 5.51% | 0.0% | 321 | 74.1 |
| gqa__falcon3_attn | 204,240 | 8.878 | 4.90% | 0.0% | 196 | 112.8 |
| gla__deltanet_attn | 233,504 | 8.890 | 0.00% | 0.0% | 341 | 80.6 |
Top 20 hybrid pairs by held-out accuracyTop 20 de pares híbridos por precisión
| Pair (A + B) | Params | Final loss | Top-1 | Top-5 | Tok/s | Train (min) |
|---|---|---|---|---|---|---|
| fox__falcon1a_attn | 214,232 | 9.292 | 12.55% | 0.0% | 507 | 79.3 |
| fox__falcon3_attn | 214,232 | 9.618 | 12.55% | 0.0% | 205 | 106.1 |
| fox__falcon3a_attn | 214,232 | 9.235 | 12.55% | 0.0% | 503 | 77.3 |
| gated_deltanet2__falcon2_attn | 250,216 | 9.105 | 12.41% | 0.0% | 271 | 80.7 |
| gated_deltanet2__falcon2a_attn | 250,216 | 8.968 | 12.41% | 0.0% | 211 | 82.1 |
| hgrn2__gated_softmax_attn | 238,688 | 9.386 | 12.30% | 25.0% | 330 | 71.7 |
| hgrn2__tucker_attn | 238,688 | 9.221 | 12.30% | 25.0% | 450 | 81.6 |
| gqla__mlra_attn | 194,624 | 9.461 | 11.85% | 0.0% | 367 | 56.0 |
| mla__mlra_attn | 194,624 | 9.464 | 11.85% | 0.0% | 343 | 86.6 |
| deltanet__kda_attn | 231,304 | 9.024 | 11.37% | 0.0% | 230 | 78.6 |
| fox__mtla_attn | 209,272 | 9.896 | 11.13% | 0.0% | 507 | 81.8 |
| nsa__falcon3a_attn | 222,735 | 9.909 | 10.75% | 0.0% | 389 | 78.9 |
| retnet__hgrn2_attn | 238,880 | 9.389 | 10.71% | 25.0% | 277 | 48.5 |
| hgrn2__conformer_attn | 270,656 | 8.812 | 10.63% | 0.0% | 286 | 89.2 |
| gla__sparda_attn | 238,688 | 9.013 | 10.52% | 25.0% | 361 | 75.0 |
| fox__falcon1_attn | 214,232 | 9.659 | 10.51% | 0.0% | 306 | 80.1 |
| gqa__mtla_attn | 199,280 | 9.367 | 10.48% | 0.0% | 448 | 90.4 |
| gqla__falcon2_attn | 217,384 | 9.219 | 10.41% | 0.0% | 345 | 37.3 |
| mla__falcon2_attn | 217,384 | 9.252 | 10.41% | 0.0% | 301 | 73.2 |
| nsa__gated_deltanet_attn | 230,991 | 9.526 | 10.35% | 25.0% | 356 | 79.7 |
| Par (A + B) | Parámetros | Pérdida final | Top-1 | Top-5 | Tok/s | Entreno (min) |
|---|---|---|---|---|---|---|
| fox__falcon1a_attn | 214,232 | 9.292 | 12.55% | 0.0% | 507 | 79.3 |
| fox__falcon3_attn | 214,232 | 9.618 | 12.55% | 0.0% | 205 | 106.1 |
| fox__falcon3a_attn | 214,232 | 9.235 | 12.55% | 0.0% | 503 | 77.3 |
| gated_deltanet2__falcon2_attn | 250,216 | 9.105 | 12.41% | 0.0% | 271 | 80.7 |
| gated_deltanet2__falcon2a_attn | 250,216 | 8.968 | 12.41% | 0.0% | 211 | 82.1 |
| hgrn2__gated_softmax_attn | 238,688 | 9.386 | 12.30% | 25.0% | 330 | 71.7 |
| hgrn2__tucker_attn | 238,688 | 9.221 | 12.30% | 25.0% | 450 | 81.6 |
| gqla__mlra_attn | 194,624 | 9.461 | 11.85% | 0.0% | 367 | 56.0 |
| mla__mlra_attn | 194,624 | 9.464 | 11.85% | 0.0% | 343 | 86.6 |
| deltanet__kda_attn | 231,304 | 9.024 | 11.37% | 0.0% | 230 | 78.6 |
| fox__mtla_attn | 209,272 | 9.896 | 11.13% | 0.0% | 507 | 81.8 |
| nsa__falcon3a_attn | 222,735 | 9.909 | 10.75% | 0.0% | 389 | 78.9 |
| retnet__hgrn2_attn | 238,880 | 9.389 | 10.71% | 25.0% | 277 | 48.5 |
| hgrn2__conformer_attn | 270,656 | 8.812 | 10.63% | 0.0% | 286 | 89.2 |
| gla__sparda_attn | 238,688 | 9.013 | 10.52% | 25.0% | 361 | 75.0 |
| fox__falcon1_attn | 214,232 | 9.659 | 10.51% | 0.0% | 306 | 80.1 |
| gqa__mtla_attn | 199,280 | 9.367 | 10.48% | 0.0% | 448 | 90.4 |
| gqla__falcon2_attn | 217,384 | 9.219 | 10.41% | 0.0% | 345 | 37.3 |
| mla__falcon2_attn | 217,384 | 9.252 | 10.41% | 0.0% | 301 | 73.2 |
| nsa__gated_deltanet_attn | 230,991 | 9.526 | 10.35% | 25.0% | 356 | 79.7 |
3 · Training dynamics3 · Dinámica de entrenamiento
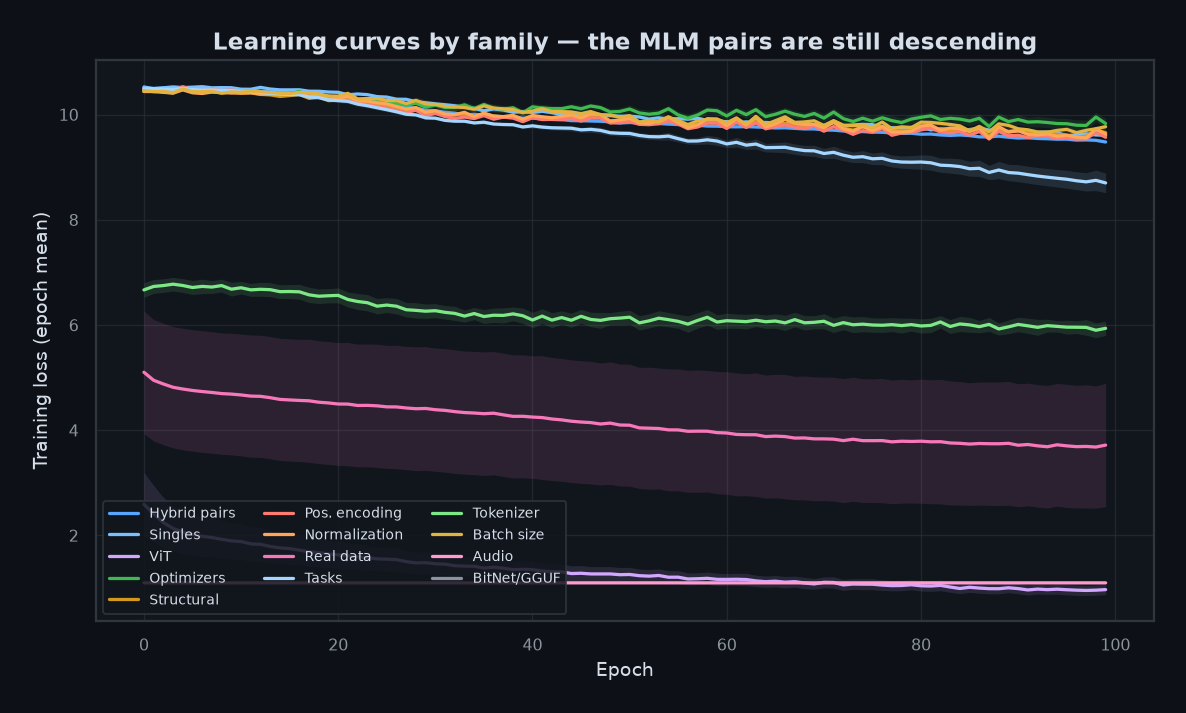
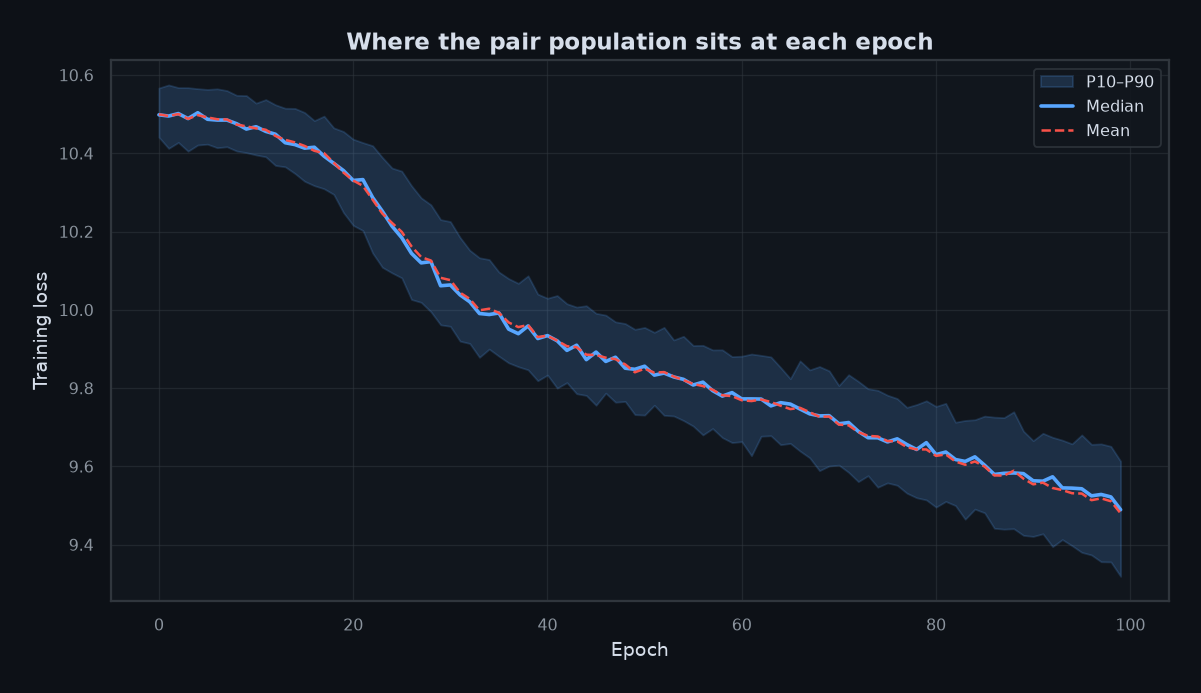
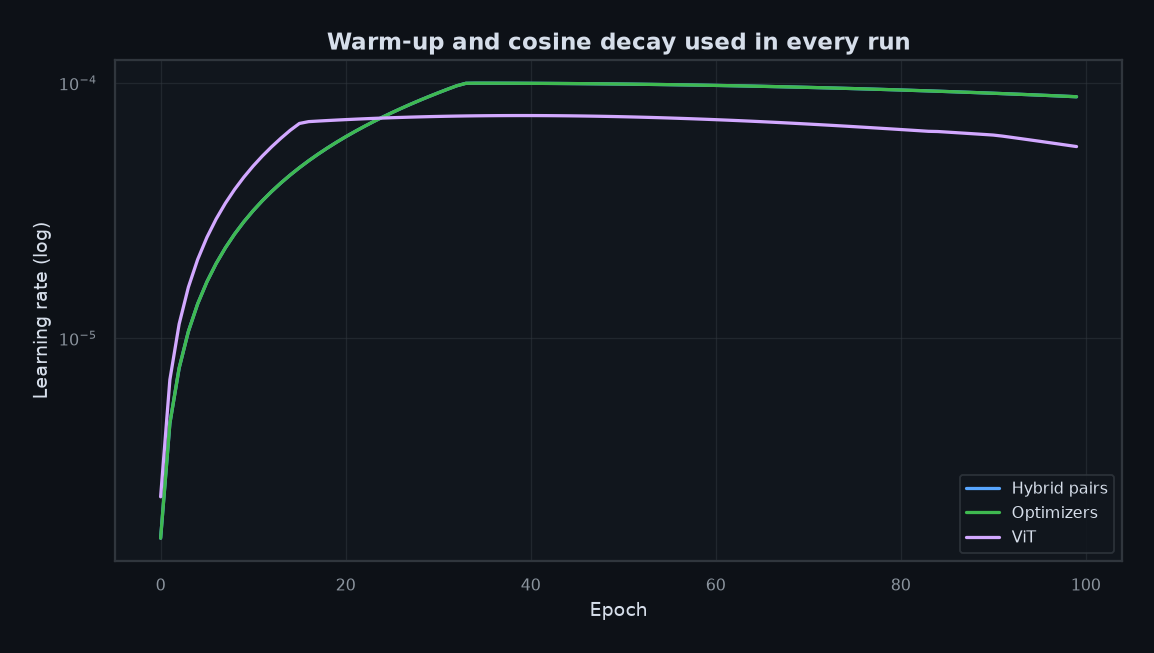
Every run uses the same warm-up plus cosine schedule, so the learning curves are directly comparable. The pair population is still descending at epoch 100 — the median loss drops from about 10.2 nats at epoch 0 to 9.49 at the end — which means the sweep measures speed of learning, not converged quality. Any ranking should be read as “which pair learns faster in 3,000 steps”.Cada corrida usa el mismo calendario de warm-up más coseno, así que las curvas de aprendizaje son directamente comparables. La población de pares sigue descendiendo en la época 100 — la pérdida mediana cae de unos 10,2 nats en la época 0 a 9,49 al final — lo que significa que la tanda mide velocidad de aprendizaje, no calidad convergida. Todo ranking debe leerse como “qué par aprende más rápido en 3.000 pasos”.
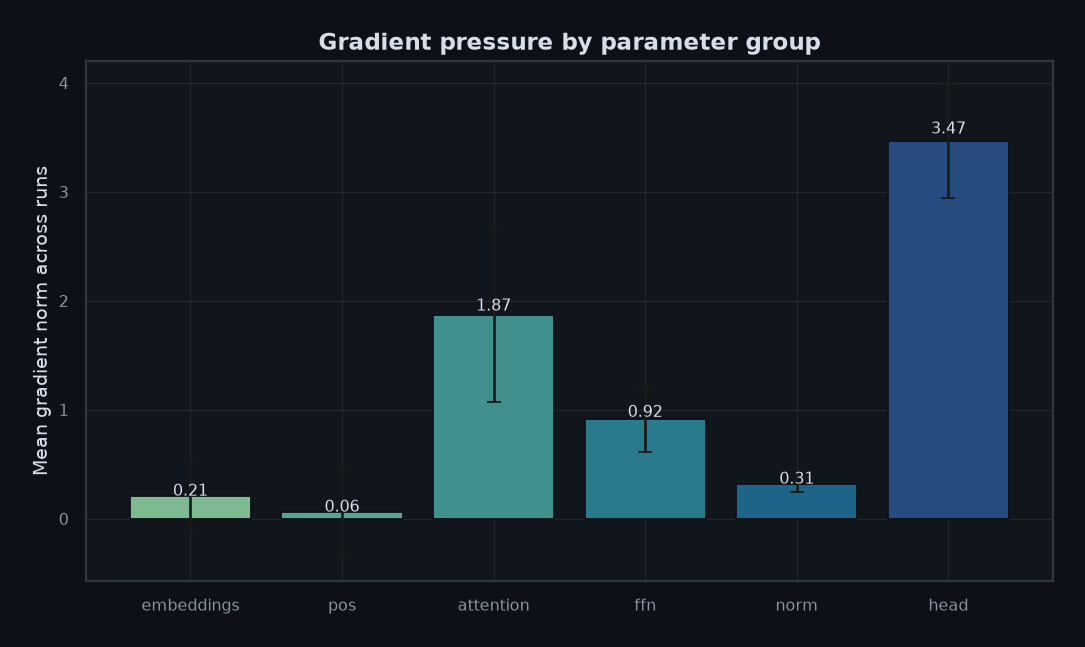
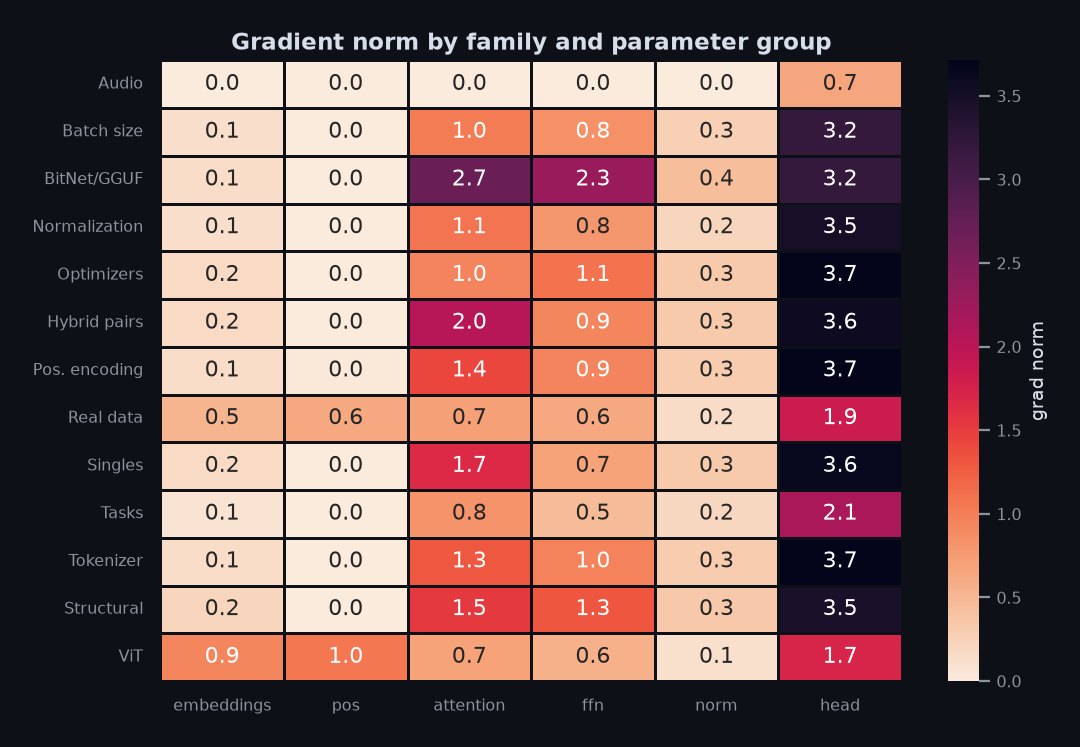
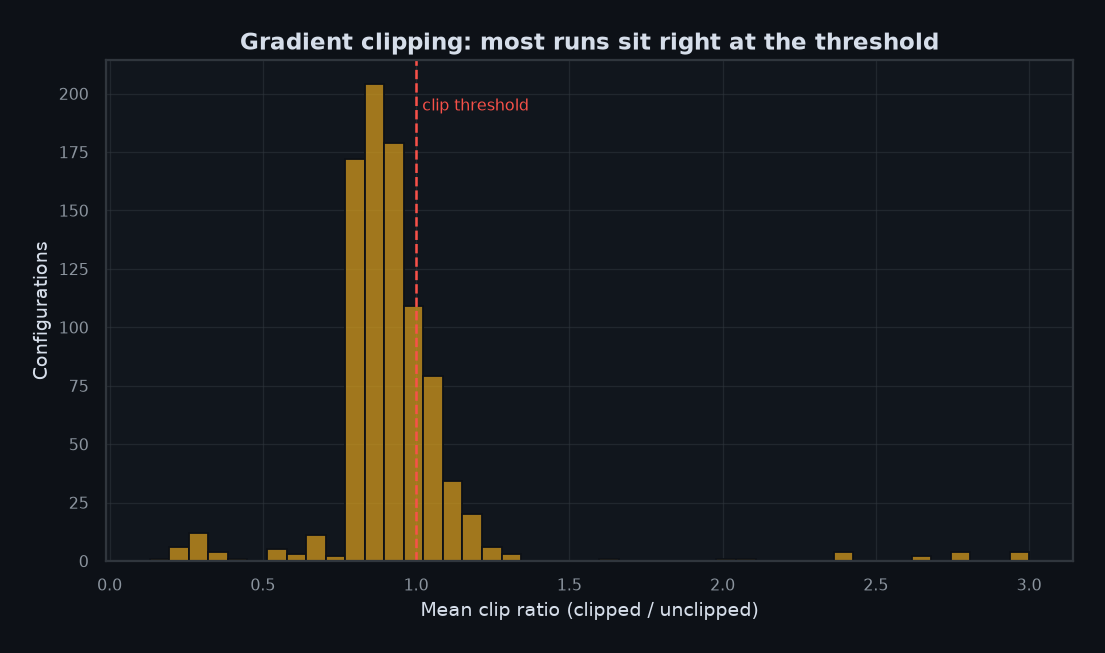
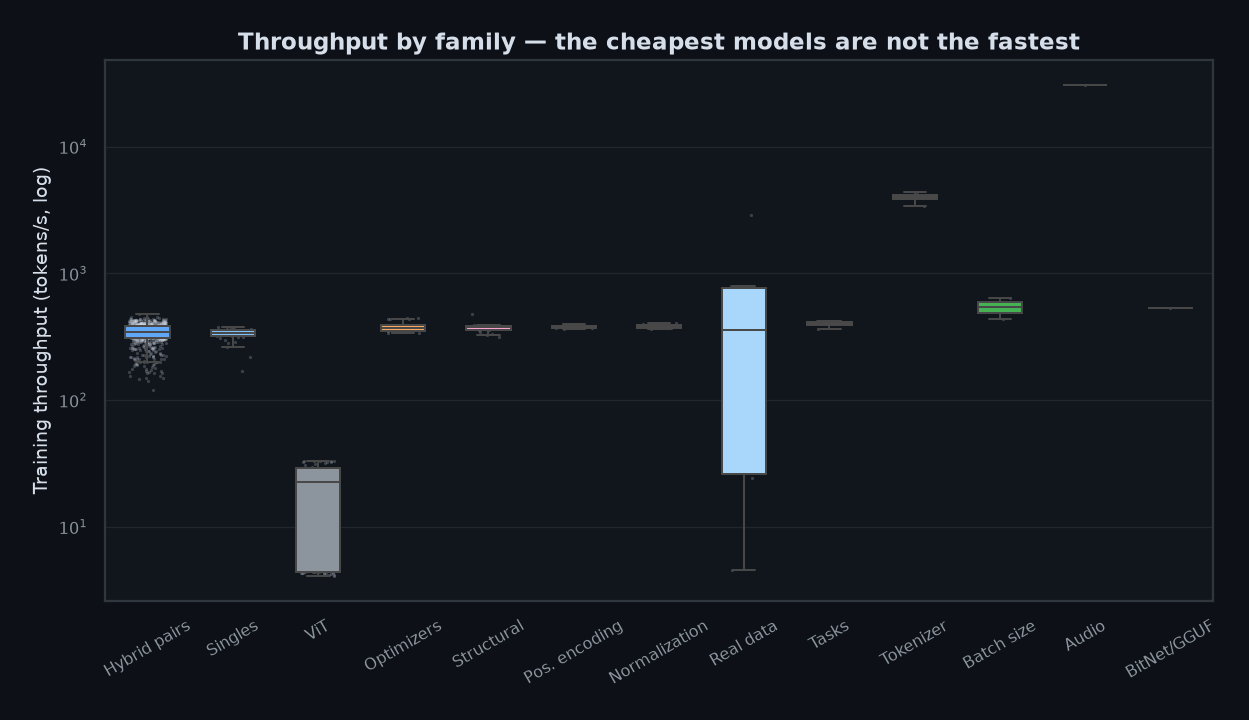
Gradient norms are remarkably stable across families (1.87 for the attention block, 0.92 for the FFN, 3.47 for the head), and the median clip ratio sits at 0.90 — below the threshold of 1.0 — so most steps pass unclipped and clipping only fires on the rare spike. Throughput medians at 357 tokens/s for the pair population; the 3k–31k tail belongs to tokenizer and audio ablations whose step timer covers only part of the work, so the Pareto analysis excludes it.Las normas de gradiente son notablemente estables entre familias (1,87 para el bloque de atención, 0,92 para la FFN, 3,47 para la cabeza) y la razón de recorte mediana es 0,90 — por debajo del umbral de 1,0 — así que la mayoría de los pasos pasan sin recorte y este solo actúa en los picos. El rendimiento mediano es 357 tokens/s para la población de pares; la cola de 3k–31k pertenece a ablaciones de tokenizer y audio cuyo cronómetro cubre solo parte del trabajo, por lo que el análisis de Pareto la excluye.
4 · The A×B atlas4 · El atlas A×B
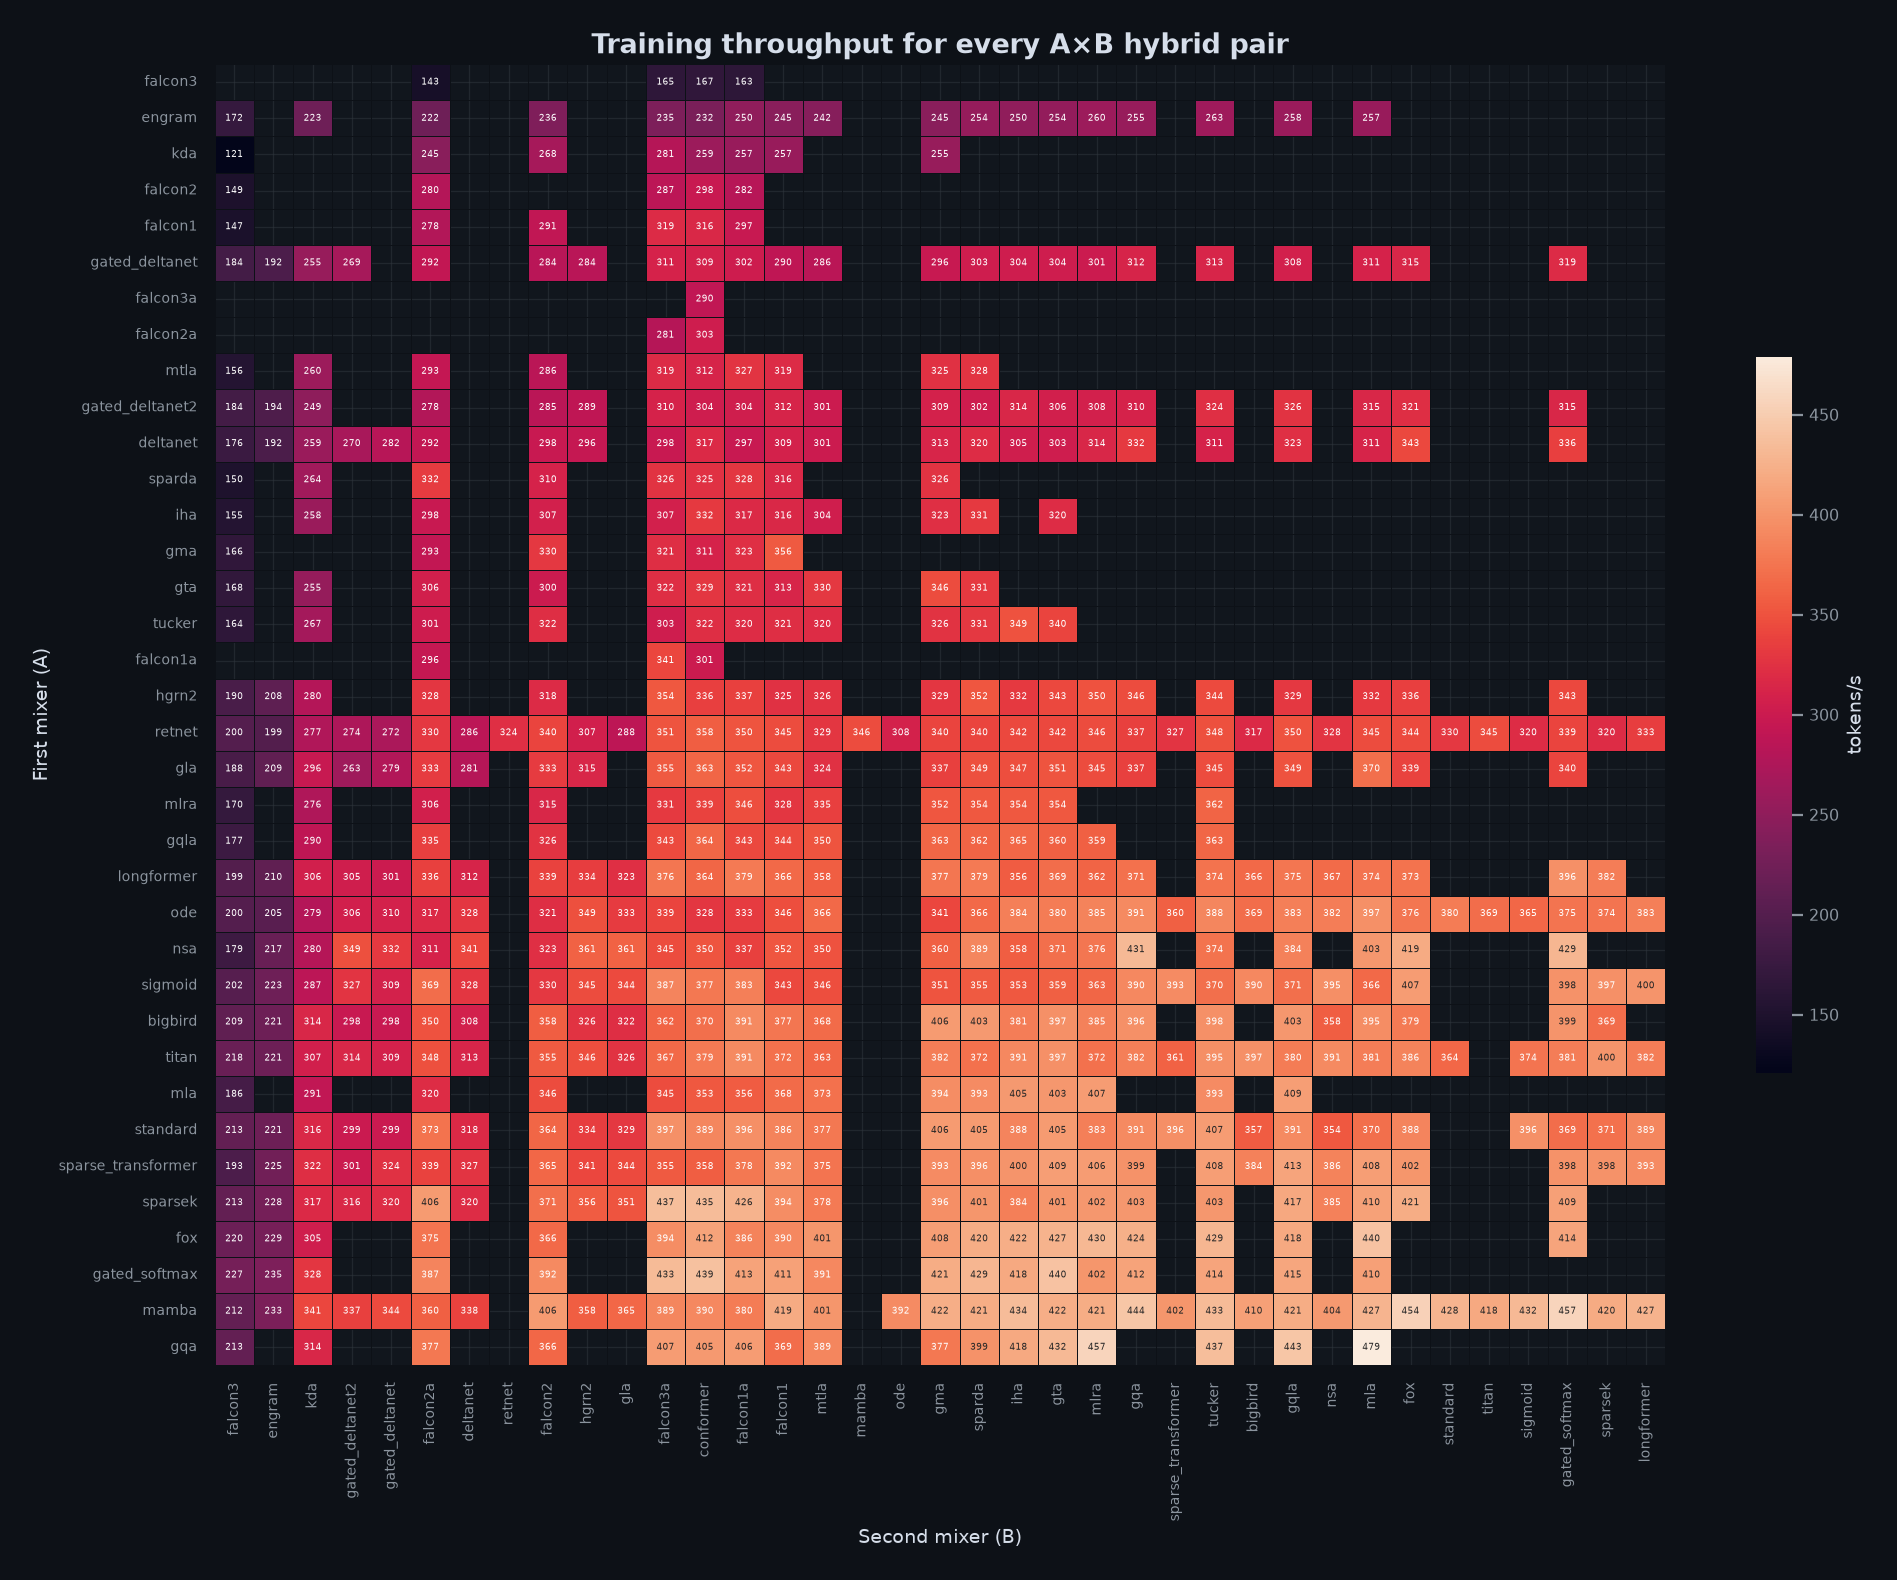
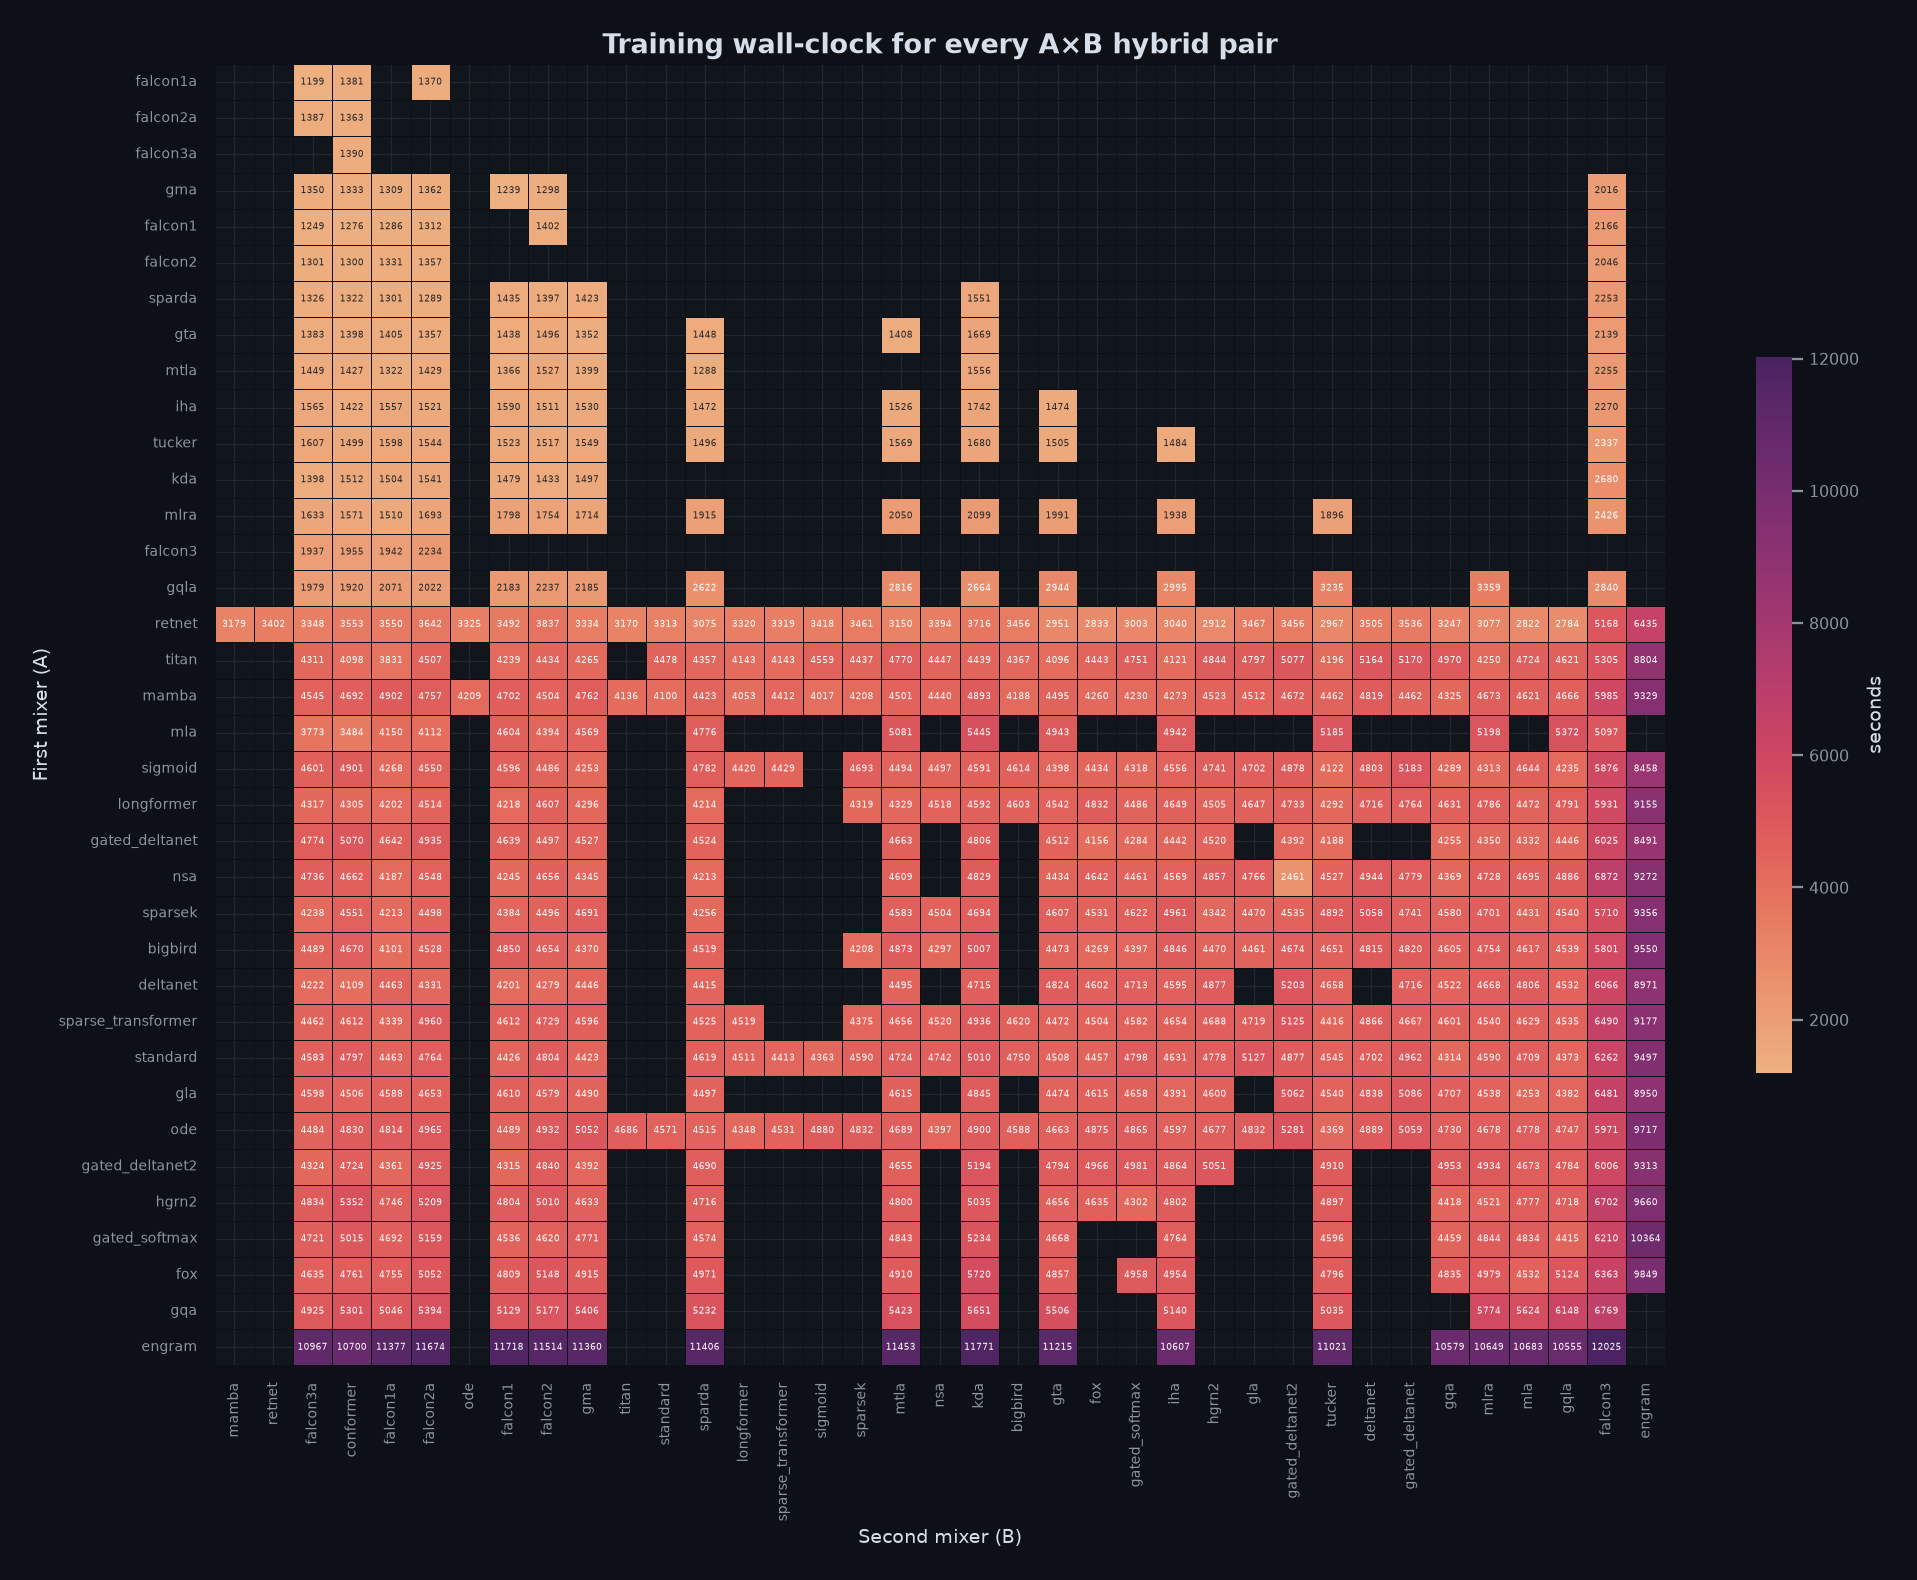
The A×B heatmaps are the centrepiece of the experiment: each cell is one hybrid pair, rows are the first mixer, columns the second. Reading them column by column reveals that the second mixer dominates the outcome: a good B (sparsek, engram, mlra) keeps almost every A in the 8.9–9.6 nat band, while a bad B (mamba, retnet, bigbird) drags even the best A above 10 nats. Reading them row by row shows the opposite asymmetry: no first mixer rescues a bad second one.Los mapas de calor A×B son el centro del experimento: cada celda es un par híbrido, las filas son el primer mixer y las columnas el segundo. Leídos por columnas revelan que el segundo mixer domina el resultado: un B bueno (sparsek, engram, mlra) mantiene casi todo A en la banda de 8,9–9,6 nats, mientras que un B malo (mamba, retnet, bigbird) arrastra incluso al mejor A por encima de 10 nats. Leídos por filas muestran la asimetría opuesta: ningún primer mixer rescata a un segundo malo.
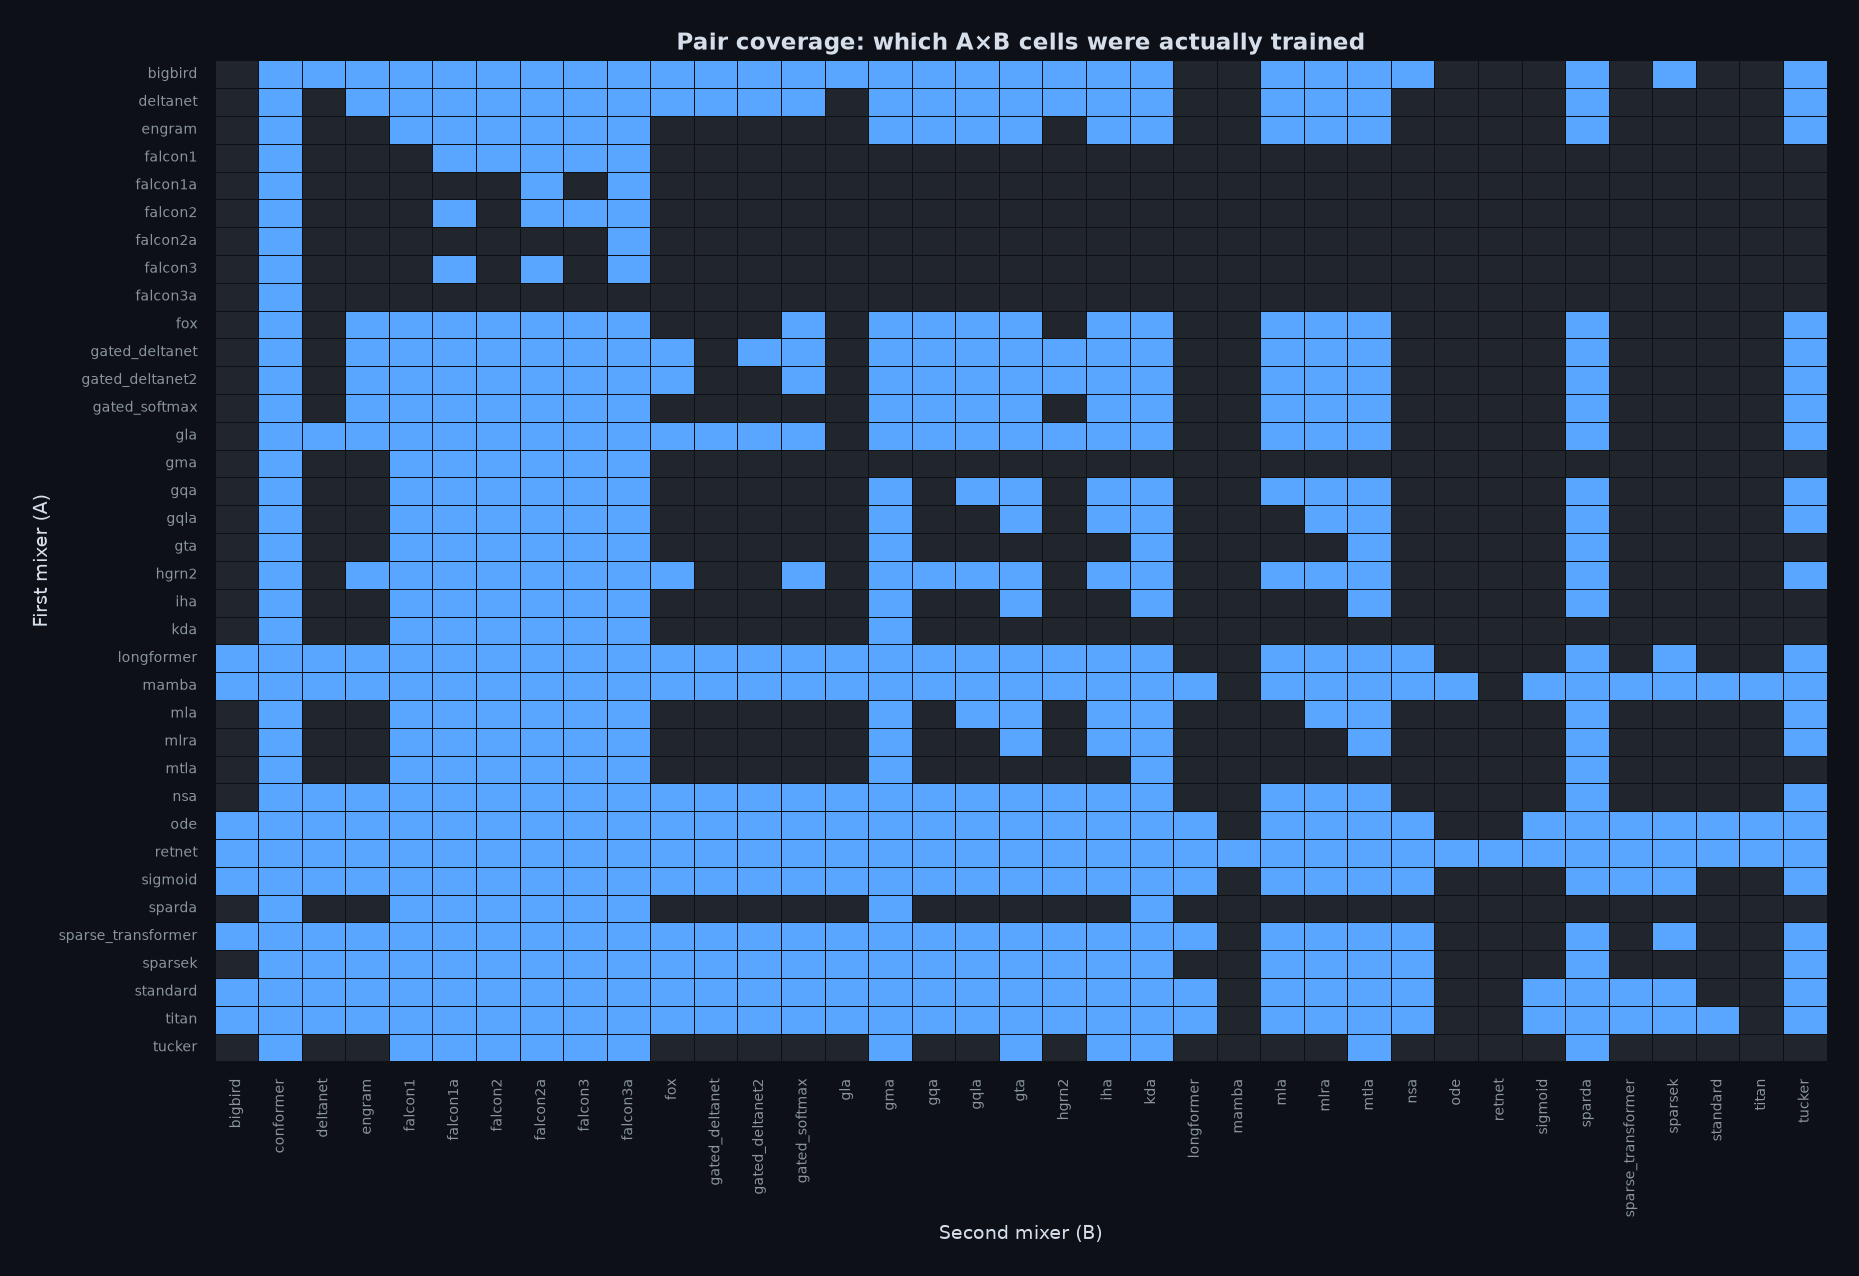
Coverage is almost complete: 667 unique pairs of the 861 possible ones were trained. The 158 pairs that never trained are exactly those containing cca, ccgqa, msa or ssog: those four mixers fail in every configuration (see §7). Parameter cost is the other axis: engram adds roughly 100k–160k parameters whenever it appears, and mamba/retnet are among the cheapest second mixers even though they are the worst performers — cheap and bad, the worst combination.La cobertura es casi completa: 667 pares únicos de los 861 posibles fueron entrenados. Los 158 pares que nunca entrenaron son exactamente los que contienen cca, ccgqa, msa o ssog: esos cuatro mixers fallan en toda configuración (ver §7). El coste es el otro eje: engram añade aproximadamente 100k–160k parámetros cada vez que aparece, y mamba/retnet están entre los segundos mixers más baratos aunque sean los peores — barato y malo, la peor combinación.
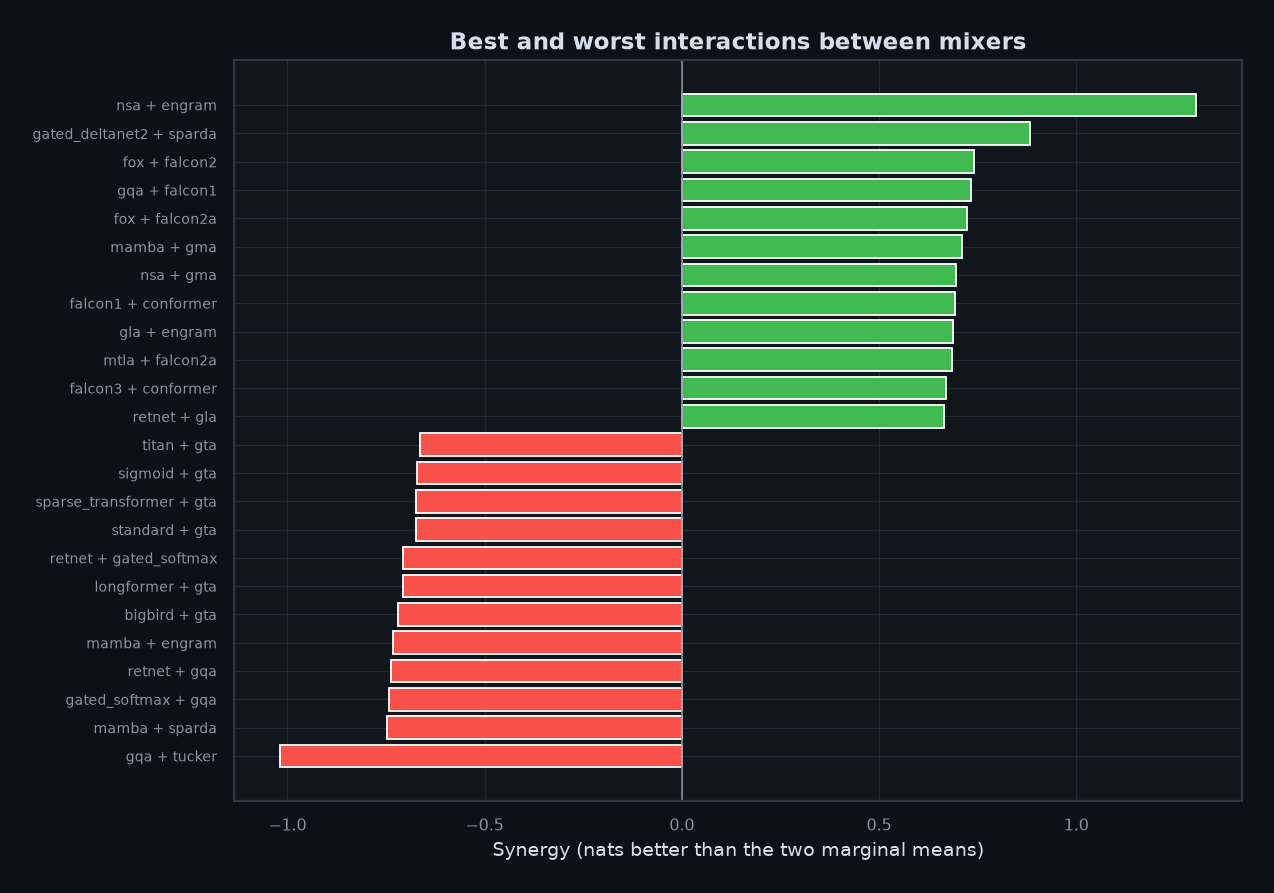
nsa+engram gains 1.304 nats, and the top ten all share a pattern: a cheap-but-clean first mixer with a memory-heavy second one. The negative tail is dominated by gta, gqa and tucker as B — mixers that look average in isolation but actively clash when stacked after a strong A.nsa+engram gana 1,304 nats, y los diez primeros comparten un patrón: un primer mixer barato pero limpio con un segundo mixer de memoria pesada. La cola negativa está dominada por gta, gqa y tucker como B — mixers que parecen promedio en aislamiento pero chocan al apilarse tras un A fuerte.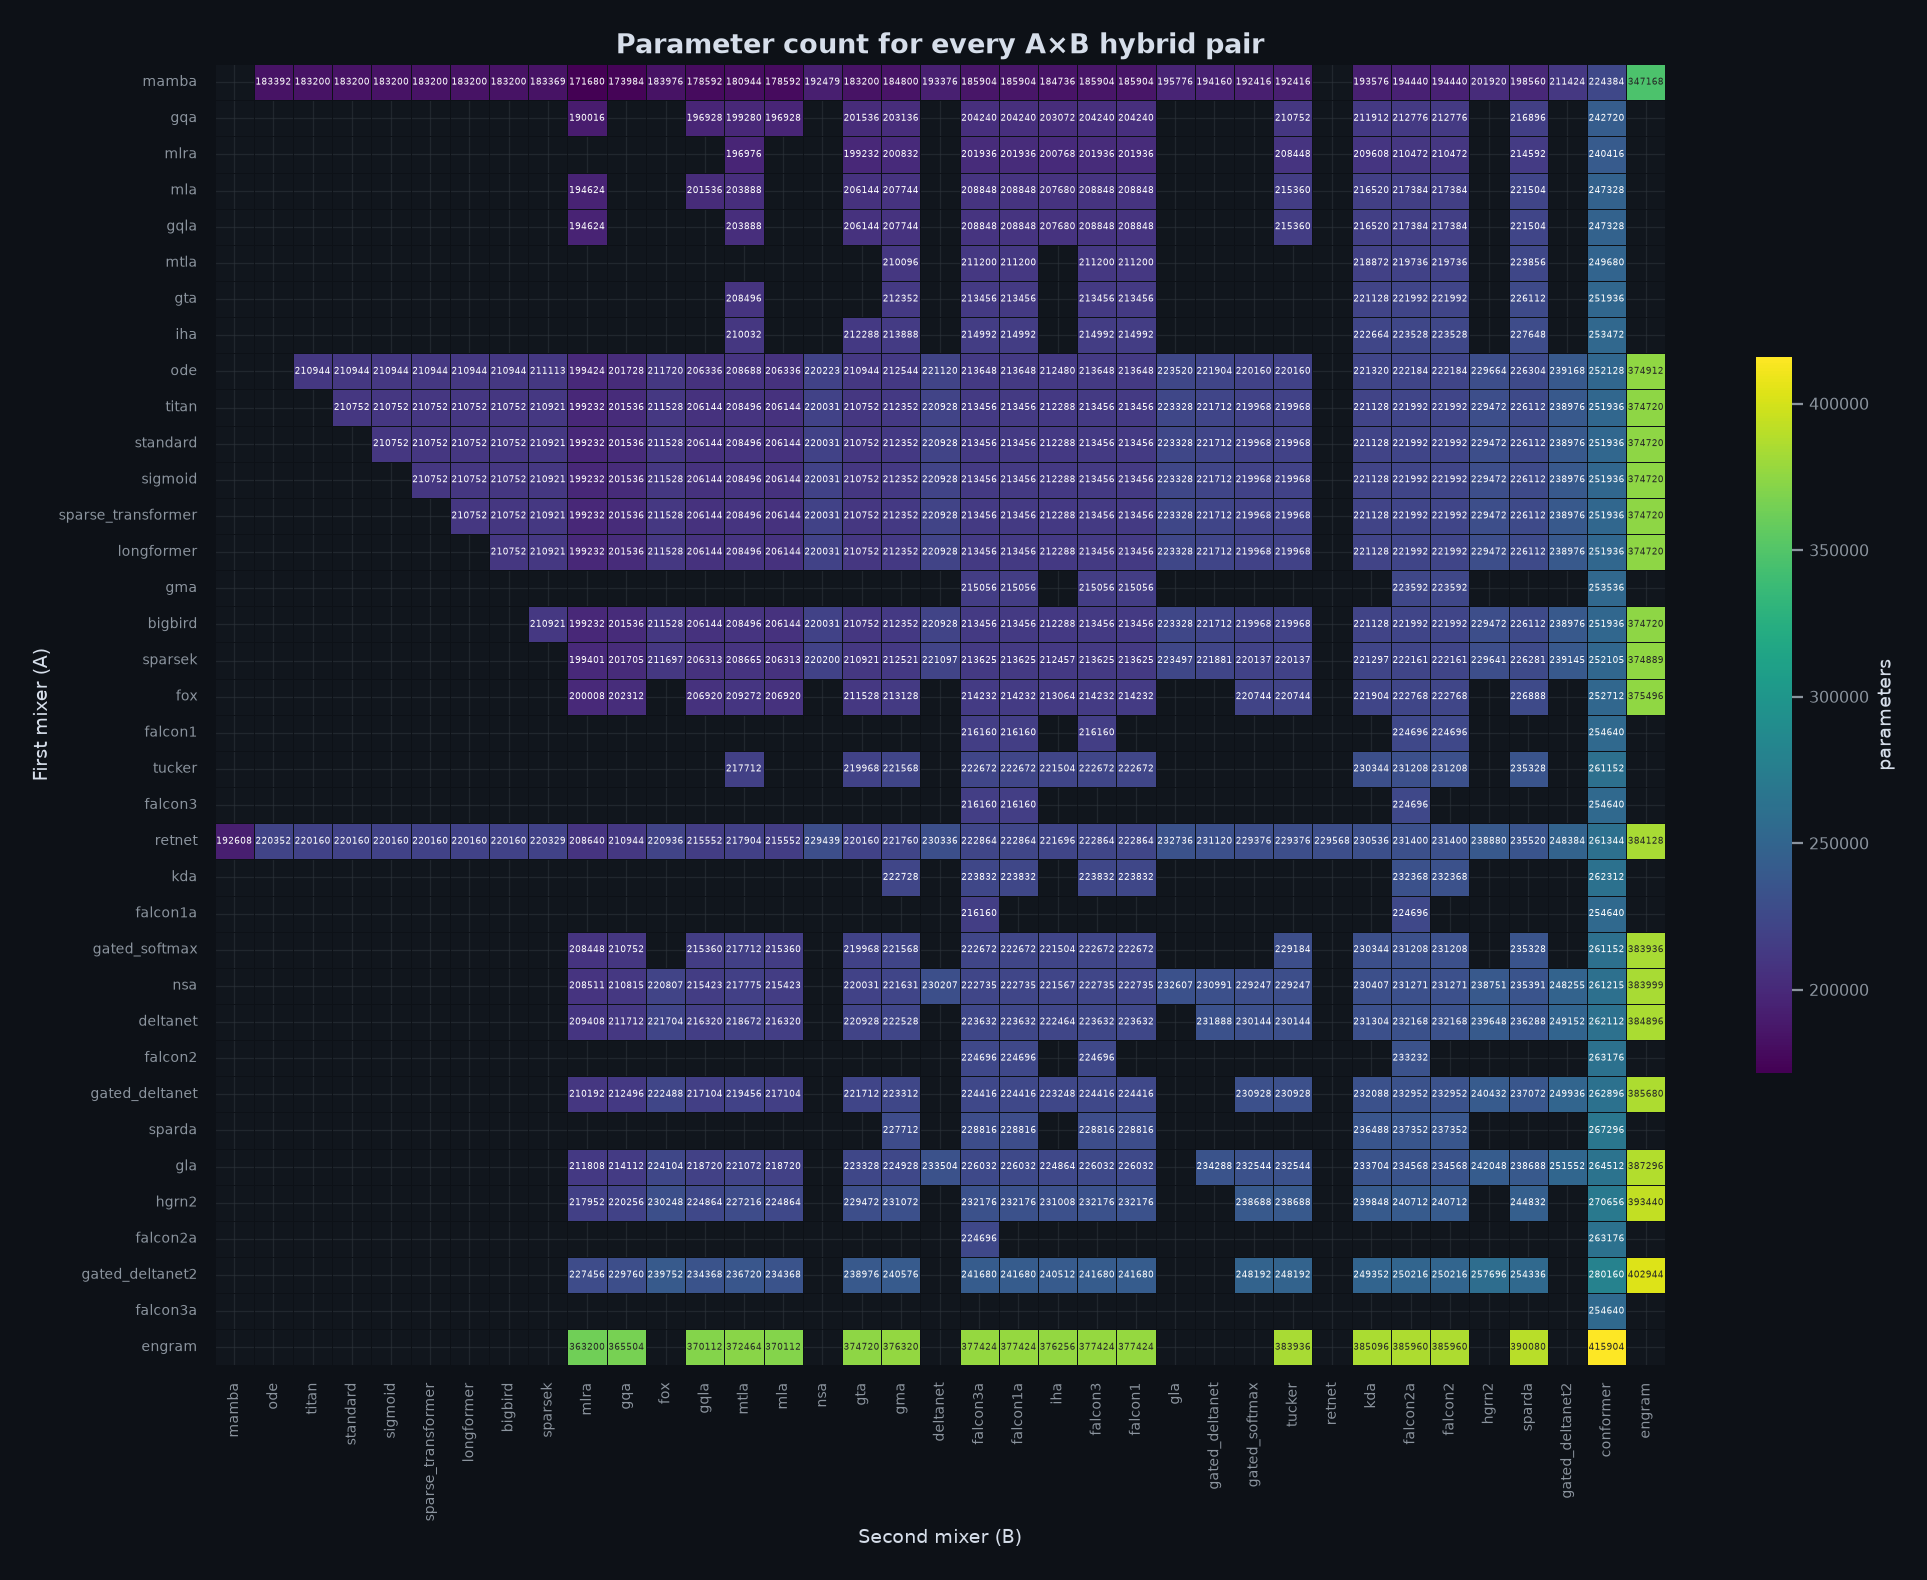
Which second mixer should you pick?¿Qué segundo mixer conviene elegir?
Ranked by mean final loss across every pair that contains the mixer; the Pairs column shows how many samples back each mean, and a single-pair mean (for example mamba) is anecdotal. The bottom half is as informative as the top: mamba, retnet, bigbird and longformer are cheap but consistently drag the pair down, which is exactly the pattern the heatmaps show.Ordenados por pérdida final media en todos los pares que contienen el mixer; la columna Pares indica cuántas muestras respaldan cada media, y una media de un solo par (por ejemplo mamba) es anecdótica. La mitad inferior es tan informativa como la superior: mamba, retnet, bigbird y longformer son baratos pero arrastran sistemáticamente al par, justo el patrón que muestran los mapas de calor.
| Best B | Pairs | Mean loss | Mean top-1 | Mean params | Tok/s |
|---|---|---|---|---|---|
| mlra | 22 | 9.368 | 5.74% | 209,581 | 372 |
| conformer | 36 | 9.369 | 3.39% | 259,861 | 344 |
| engram | 18 | 9.373 | 2.05% | 379,284 | 252 |
| sparsek | 9 | 9.382 | 4.82% | 208,926 | 382 |
| falcon2a | 34 | 9.387 | 4.33% | 229,973 | 329 |
| fox | 16 | 9.409 | 2.23% | 216,038 | 393 |
| mla | 20 | 9.457 | 4.66% | 217,989 | 394 |
| mtla | 26 | 9.459 | 5.29% | 217,223 | 380 |
| gqla | 21 | 9.470 | 4.44% | 217,205 | 392 |
| ode | 2 | 9.475 | 4.65% | 201,872 | 396 |
| falcon2 | 31 | 9.499 | 4.68% | 230,208 | 338 |
| iha | 24 | 9.502 | 3.05% | 221,679 | 377 |
| Mejor B | Pares | Pérdida media | Top-1 medio | Parámetros medios | tok/s |
|---|---|---|---|---|---|
| mlra | 22 | 9.368 | 5.74% | 209,581 | 372 |
| conformer | 36 | 9.369 | 3.39% | 259,861 | 344 |
| engram | 18 | 9.373 | 2.05% | 379,284 | 252 |
| sparsek | 9 | 9.382 | 4.82% | 208,926 | 382 |
| falcon2a | 34 | 9.387 | 4.33% | 229,973 | 329 |
| fox | 16 | 9.409 | 2.23% | 216,038 | 393 |
| mla | 20 | 9.457 | 4.66% | 217,989 | 394 |
| mtla | 26 | 9.459 | 5.29% | 217,223 | 380 |
| gqla | 21 | 9.470 | 4.44% | 217,205 | 392 |
| ode | 2 | 9.475 | 4.65% | 201,872 | 396 |
| falcon2 | 31 | 9.499 | 4.68% | 230,208 | 338 |
| iha | 24 | 9.502 | 3.05% | 221,679 | 377 |
| Worst B | Pairs | Mean loss | Mean top-1 | Mean params | Tok/s |
|---|---|---|---|---|---|
| mamba | 1 | 10.279 | 2.04% | 192,608 | 398 |
| bigbird | 8 | 10.177 | 7.42% | 208,508 | 463 |
| longformer | 7 | 10.145 | 7.38% | 208,187 | 417 |
| retnet | 1 | 10.142 | 4.08% | 229,568 | 343 |
| sparse_transformer | 6 | 10.108 | 5.59% | 207,760 | 409 |
| sigmoid | 5 | 10.045 | 4.37% | 207,162 | 417 |
| standard | 4 | 9.960 | 6.65% | 206,264 | 429 |
| gla | 11 | 9.814 | 3.90% | 222,555 | 341 |
| titan | 3 | 9.814 | 6.28% | 204,768 | 436 |
| gta | 25 | 9.788 | 3.27% | 219,828 | 390 |
| falcon1 | 30 | 9.779 | 3.27% | 221,856 | 335 |
| falcon3 | 32 | 9.751 | 3.39% | 221,766 | 191 |
| Peor B | Pares | Pérdida media | Top-1 medio | Parámetros medios | tok/s |
|---|---|---|---|---|---|
| mamba | 1 | 10.279 | 2.04% | 192,608 | 398 |
| bigbird | 8 | 10.177 | 7.42% | 208,508 | 463 |
| longformer | 7 | 10.145 | 7.38% | 208,187 | 417 |
| retnet | 1 | 10.142 | 4.08% | 229,568 | 343 |
| sparse_transformer | 6 | 10.108 | 5.59% | 207,760 | 409 |
| sigmoid | 5 | 10.045 | 4.37% | 207,162 | 417 |
| standard | 4 | 9.960 | 6.65% | 206,264 | 429 |
| gla | 11 | 9.814 | 3.90% | 222,555 | 341 |
| titan | 3 | 9.814 | 6.28% | 204,768 | 436 |
| gta | 25 | 9.788 | 3.27% | 219,828 | 390 |
| falcon1 | 30 | 9.779 | 3.27% | 221,856 | 335 |
| falcon3 | 32 | 9.751 | 3.39% | 221,766 | 191 |
Synergy leaderboardTabla de sinergia
Synergy = (mean loss of A's pairs + mean loss of B's pairs) / 2 − loss of the A+B pair. Positive values mean the pair is better than its parts suggest; negative values mean the two mixers interfere.Sinergia = (pérdida media de los pares de A + pérdida media de los pares de B) / 2 − pérdida del par A+B. Los valores positivos indican que el par es mejor de lo que sugieren sus partes; los negativos, que los dos mixers interfieren.
| Pair | Pair loss | Expected | Synergy | Top-1 |
|---|---|---|---|---|
| nsa + engram | 8.116 | 9.420 | +1.304 | 0.00% |
| gated_deltanet2 + sparda | 8.567 | 9.448 | +0.881 | 0.00% |
| fox + falcon2 | 8.705 | 9.446 | +0.741 | 2.40% |
| gqa + falcon1 | 8.784 | 9.518 | +0.734 | 2.86% |
| fox + falcon2a | 8.666 | 9.390 | +0.724 | 2.40% |
| mamba + gma | 8.934 | 9.644 | +0.710 | 2.20% |
| nsa + gma | 8.825 | 9.521 | +0.696 | 2.88% |
| falcon1 + conformer | 8.639 | 9.333 | +0.694 | 4.67% |
| gla + engram | 8.736 | 9.424 | +0.688 | 5.17% |
| mtla + falcon2a | 8.764 | 9.449 | +0.686 | 1.30% |
| Par | Pérdida del par | Esperada | Sinergia | Top-1 |
|---|---|---|---|---|
| nsa + engram | 8.116 | 9.420 | +1.304 | 0.00% |
| gated_deltanet2 + sparda | 8.567 | 9.448 | +0.881 | 0.00% |
| fox + falcon2 | 8.705 | 9.446 | +0.741 | 2.40% |
| gqa + falcon1 | 8.784 | 9.518 | +0.734 | 2.86% |
| fox + falcon2a | 8.666 | 9.390 | +0.724 | 2.40% |
| mamba + gma | 8.934 | 9.644 | +0.710 | 2.20% |
| nsa + gma | 8.825 | 9.521 | +0.696 | 2.88% |
| falcon1 + conformer | 8.639 | 9.333 | +0.694 | 4.67% |
| gla + engram | 8.736 | 9.424 | +0.688 | 5.17% |
| mtla + falcon2a | 8.764 | 9.449 | +0.686 | 1.30% |
| Pair | Pair loss | Expected | Synergy | Top-1 |
|---|---|---|---|---|
| gqa + tucker | 10.450 | 9.432 | -1.018 | 7.76% |
| mamba + sparda | 10.391 | 9.643 | -0.749 | 5.09% |
| gated_softmax + gqa | 10.447 | 9.703 | -0.744 | 1.79% |
| retnet + gqa | 10.348 | 9.612 | -0.737 | 1.79% |
| mamba + engram | 10.277 | 9.543 | -0.734 | 1.10% |
| bigbird + gta | 10.445 | 9.725 | -0.720 | 1.79% |
| longformer + gta | 10.445 | 9.738 | -0.707 | 1.79% |
| retnet + gated_softmax | 10.239 | 9.533 | -0.706 | 7.70% |
| standard + gta | 10.445 | 9.772 | -0.673 | 1.79% |
| sparse_transformer + gta | 10.422 | 9.749 | -0.673 | 1.79% |
| Par | Pérdida del par | Esperada | Sinergia | Top-1 |
|---|---|---|---|---|
| gqa + tucker | 10.450 | 9.432 | -1.018 | 7.76% |
| mamba + sparda | 10.391 | 9.643 | -0.749 | 5.09% |
| gated_softmax + gqa | 10.447 | 9.703 | -0.744 | 1.79% |
| retnet + gqa | 10.348 | 9.612 | -0.737 | 1.79% |
| mamba + engram | 10.277 | 9.543 | -0.734 | 1.10% |
| bigbird + gta | 10.445 | 9.725 | -0.720 | 1.79% |
| longformer + gta | 10.445 | 9.738 | -0.707 | 1.79% |
| retnet + gated_softmax | 10.239 | 9.533 | -0.706 | 7.70% |
| standard + gta | 10.445 | 9.772 | -0.673 | 1.79% |
| sparse_transformer + gta | 10.422 | 9.749 | -0.673 | 1.79% |
5 · Ablations: optimizers, norms, encodings, structure5 · Ablaciones: optimizadores, normas, codificaciones, estructura
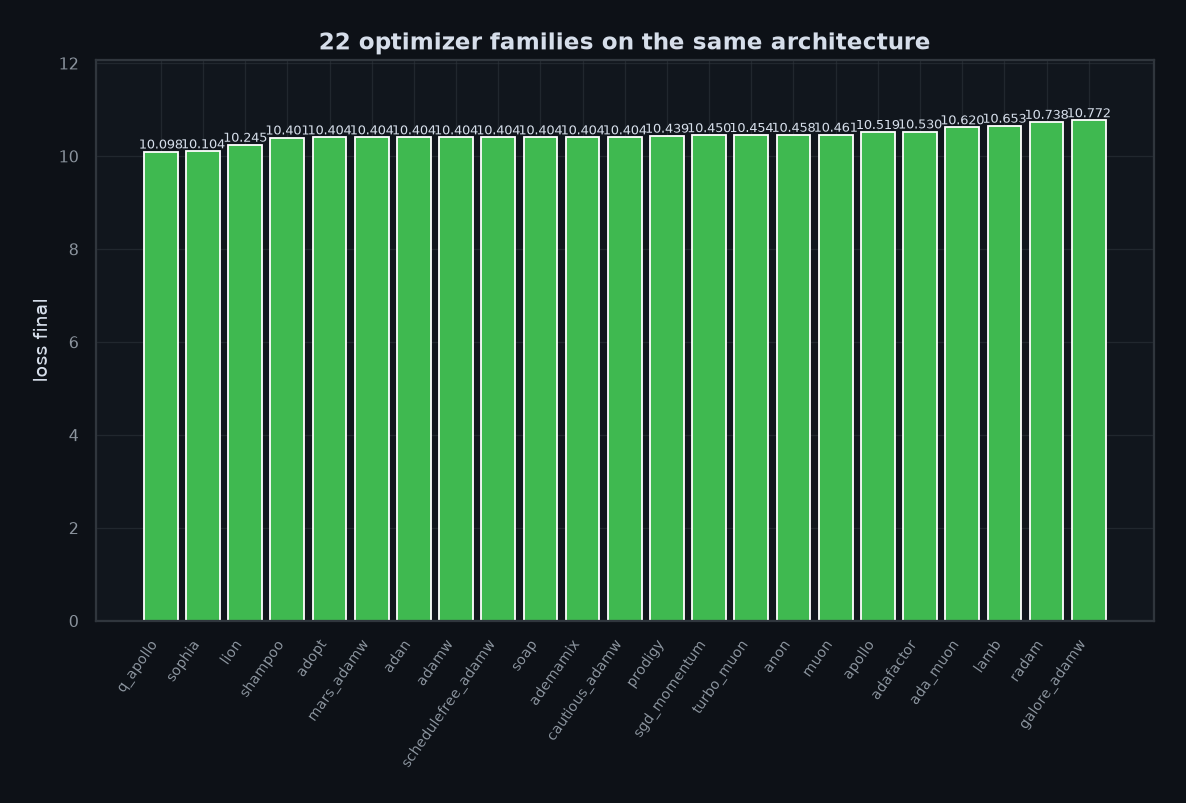
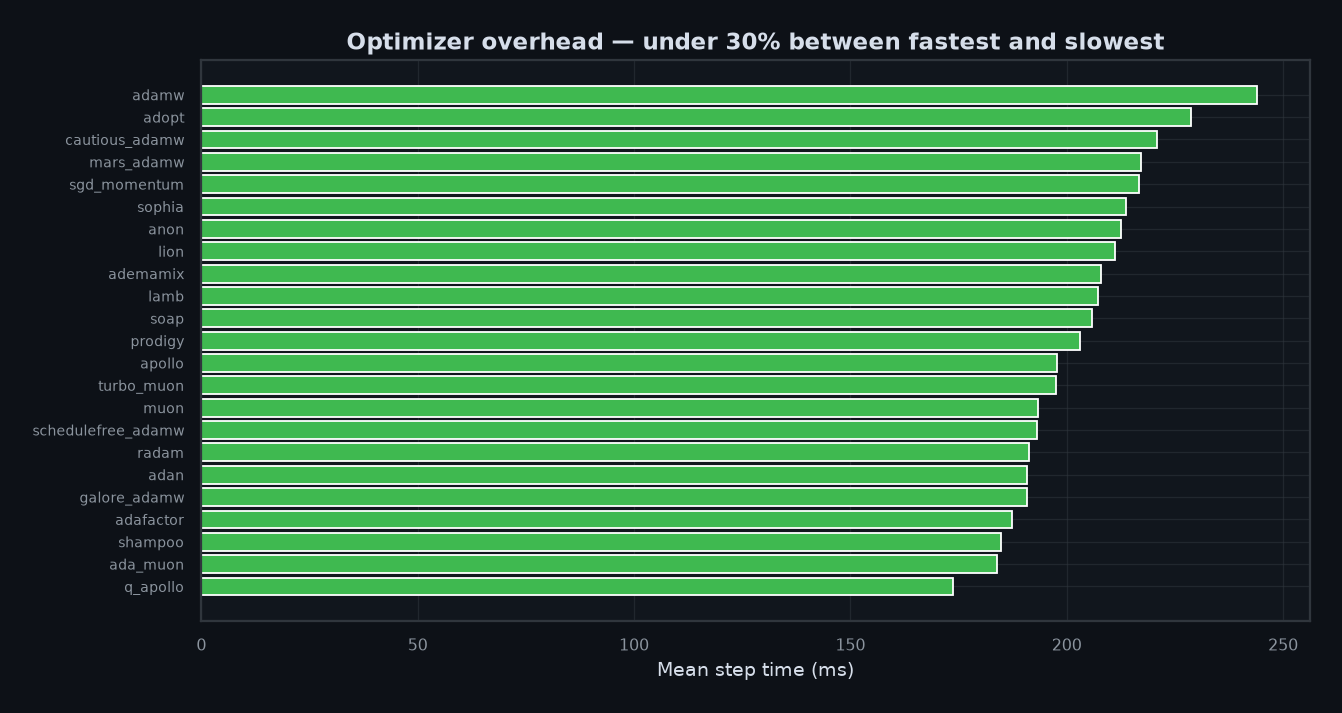
The optimizer sweep is the most sobering chart: 23 optimizers, the same 210k backbone, and a 10.10–10.77 nat range. q_apollo wins at 10.098 and galore_adamw closes the table at 10.772, but a dozen optimizers land on exactly 10.404 — the run is too short for the optimizer choice to separate from seed noise. Speed differences are real, however: step time varies by about 30% and shampoo/muon pay visible overhead.La barrida de optimizadores es el gráfico más aleccionador: 23 optimizadores, el mismo esqueleto de 210k y un rango de 10,10–10,77 nats. q_apollo gana con 10,098 y galore_adamw cierra la tabla con 10,772, pero una docena de optimizadores aterrizan exactamente en 10,404 — la corrida es demasiado corta para separar la elección del ruido de semilla. Las diferencias de velocidad sí son reales: el tiempo por paso varía un 30 % y shampoo/muon pagan sobrecoste visible.
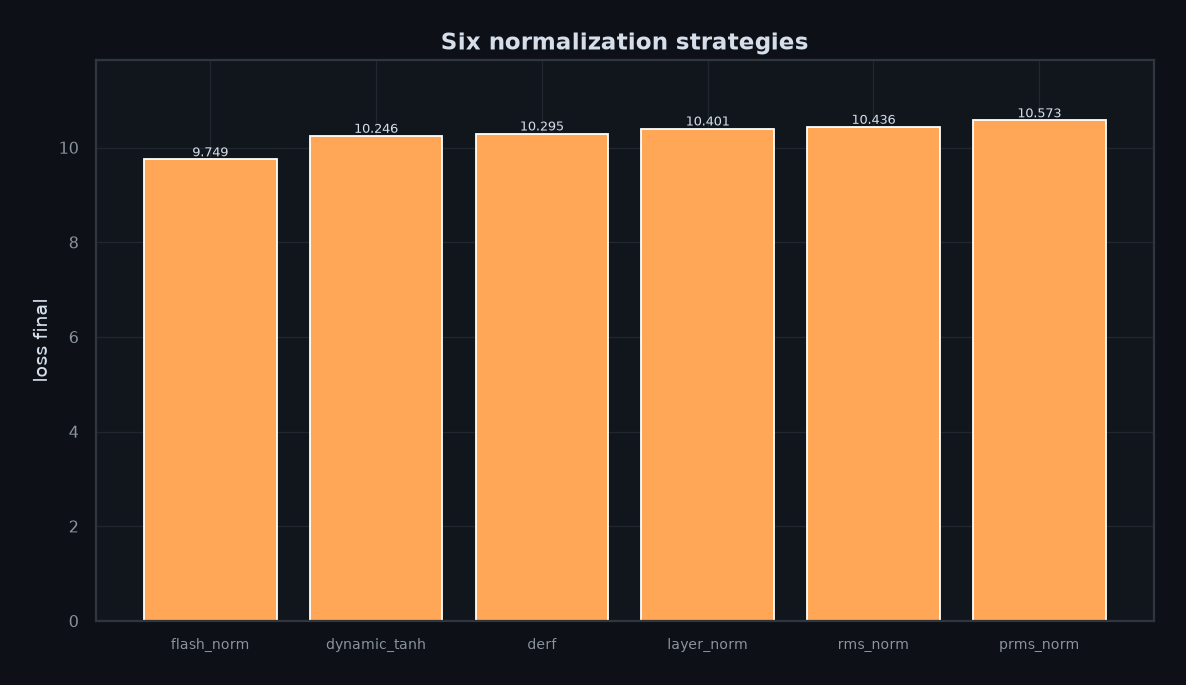
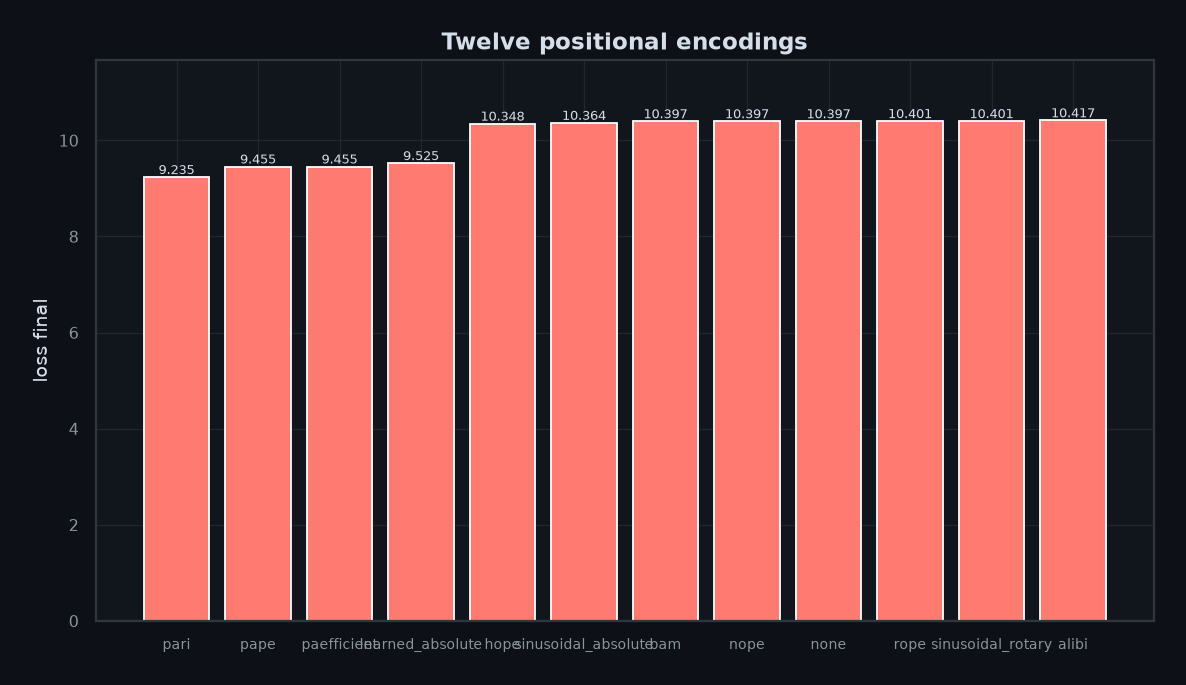
Among normalizations, flash_norm is the clear winner (9.749 nats, 0.50 ahead of the runner-up), while prms_norm and rms_norm lag. In positional encodings the PAPE family (pape_ri, pape, pape_efficient) sweeps the podium, and classical RoPE is mid-table at this scale — a reminder that “modern” is not automatically better on a 100-epoch toy run.Entre las normalizaciones, flash_norm gana con claridad (9,749 nats, 0,50 por delante del segundo), mientras que prms_norm y rms_norm quedan atrás. En codificaciones posicionales la familia PAPE (pape_ri, pape, pape_efficient) barre el podio, y RoPE clásico queda a media tabla a esta escala — recordatorio de que “moderno” no es automáticamente mejor en una corrida de juguete de 100 épocas.
Optimizer sweepBarrida de optimizadores
| Optimizer | Final loss | Top-1 | Params | Tok/s |
|---|---|---|---|---|
| q_apollo | 10.098 | 3.63% | 210,752 | 436 |
| sophia | 10.104 | 1.79% | 210,752 | 378 |
| lion | 10.245 | 4.64% | 210,752 | 279 |
| shampoo | 10.401 | 7.76% | 210,752 | 382 |
| adopt | 10.404 | 7.76% | 210,752 | 391 |
| mars_adamw | 10.404 | 7.76% | 210,752 | 343 |
| adan | 10.404 | 7.76% | 210,752 | 359 |
| adamw | 10.404 | 7.76% | 210,752 | 384 |
| schedulefree_adamw | 10.404 | 7.76% | 210,752 | 487 |
| soap | 10.404 | 7.76% | 210,752 | 412 |
| ademamix | 10.404 | 7.76% | 210,752 | 366 |
| cautious_adamw | 10.404 | 7.76% | 210,752 | 365 |
| prodigy | 10.439 | 0.00% | 210,752 | 349 |
| sgd_momentum | 10.450 | 0.00% | 210,752 | 347 |
| turbo_muon | 10.454 | 0.00% | 210,752 | 536 |
| anon | 10.458 | 0.00% | 210,752 | 387 |
| muon | 10.461 | 0.00% | 210,752 | 507 |
| apollo | 10.519 | 0.00% | 210,752 | 401 |
| adafactor | 10.530 | 0.00% | 210,752 | 395 |
| ada_muon | 10.620 | 1.79% | 210,752 | 497 |
| lamb | 10.653 | 7.76% | 210,752 | 464 |
| radam | 10.738 | 7.76% | 210,752 | 502 |
| galore_adamw | 10.772 | 9.54% | 210,752 | 451 |
| Optimizador | Pérdida final | Top-1 | Parámetros | tok/s |
|---|---|---|---|---|
| q_apollo | 10.098 | 3.63% | 210,752 | 436 |
| sophia | 10.104 | 1.79% | 210,752 | 378 |
| lion | 10.245 | 4.64% | 210,752 | 279 |
| shampoo | 10.401 | 7.76% | 210,752 | 382 |
| adopt | 10.404 | 7.76% | 210,752 | 391 |
| mars_adamw | 10.404 | 7.76% | 210,752 | 343 |
| adan | 10.404 | 7.76% | 210,752 | 359 |
| adamw | 10.404 | 7.76% | 210,752 | 384 |
| schedulefree_adamw | 10.404 | 7.76% | 210,752 | 487 |
| soap | 10.404 | 7.76% | 210,752 | 412 |
| ademamix | 10.404 | 7.76% | 210,752 | 366 |
| cautious_adamw | 10.404 | 7.76% | 210,752 | 365 |
| prodigy | 10.439 | 0.00% | 210,752 | 349 |
| sgd_momentum | 10.450 | 0.00% | 210,752 | 347 |
| turbo_muon | 10.454 | 0.00% | 210,752 | 536 |
| anon | 10.458 | 0.00% | 210,752 | 387 |
| muon | 10.461 | 0.00% | 210,752 | 507 |
| apollo | 10.519 | 0.00% | 210,752 | 401 |
| adafactor | 10.530 | 0.00% | 210,752 | 395 |
| ada_muon | 10.620 | 1.79% | 210,752 | 497 |
| lamb | 10.653 | 7.76% | 210,752 | 464 |
| radam | 10.738 | 7.76% | 210,752 | 502 |
| galore_adamw | 10.772 | 9.54% | 210,752 | 451 |
Normalization and positional encodingNormalización y codificación posicional
| Variant | Final loss | Top-1 | Params | Tok/s |
|---|---|---|---|---|
| flash_norm | 9.749 | 1.43% | 209,600 | 406 |
| dynamic_tanh | 10.246 | 0.00% | 210,752 | 384 |
| derf | 10.295 | 1.79% | 210,762 | 423 |
| layer_norm | 10.401 | 7.76% | 210,752 | 381 |
| rms_norm | 10.436 | 7.76% | 210,272 | 409 |
| prms_norm | 10.573 | 0.00% | 210,272 | 422 |
| pari | 9.235 | 0.00% | 211,520 | 274 |
| pape | 9.455 | 4.17% | 216,928 | 358 |
| paefficient | 9.455 | 4.17% | 216,928 | 358 |
| learned_absolute | 9.525 | 7.02% | 216,896 | 417 |
| hope | 10.348 | — | 210,752 | 400 |
| sinusoidal_absolute | 10.364 | 6.68% | 210,752 | 452 |
| bam | 10.397 | 9.54% | 210,768 | 404 |
| nope | 10.397 | 9.54% | 210,752 | 409 |
| none | 10.397 | 9.54% | 210,752 | 420 |
| rope | 10.401 | 7.76% | 210,752 | 295 |
| sinusoidal_rotary | 10.401 | 7.76% | 210,752 | 279 |
| alibi | 10.417 | 7.76% | 210,752 | 443 |
| Variante | Pérdida final | Top-1 | Parámetros | tok/s |
|---|---|---|---|---|
| flash_norm | 9.749 | 1.43% | 209,600 | 406 |
| dynamic_tanh | 10.246 | 0.00% | 210,752 | 384 |
| derf | 10.295 | 1.79% | 210,762 | 423 |
| layer_norm | 10.401 | 7.76% | 210,752 | 381 |
| rms_norm | 10.436 | 7.76% | 210,272 | 409 |
| prms_norm | 10.573 | 0.00% | 210,272 | 422 |
| pari | 9.235 | 0.00% | 211,520 | 274 |
| pape | 9.455 | 4.17% | 216,928 | 358 |
| paefficient | 9.455 | 4.17% | 216,928 | 358 |
| learned_absolute | 9.525 | 7.02% | 216,896 | 417 |
| hope | 10.348 | — | 210,752 | 400 |
| sinusoidal_absolute | 10.364 | 6.68% | 210,752 | 452 |
| bam | 10.397 | 9.54% | 210,768 | 404 |
| nope | 10.397 | 9.54% | 210,752 | 409 |
| none | 10.397 | 9.54% | 210,752 | 420 |
| rope | 10.401 | 7.76% | 210,752 | 295 |
| sinusoidal_rotary | 10.401 | 7.76% | 210,752 | 279 |
| alibi | 10.417 | 7.76% | 210,752 | 443 |
Structural switchesConmutadores estructurales
| Switch | Final loss | Top-1 | Params | Tok/s |
|---|---|---|---|---|
| factorized_emb | 9.623 | 1.43% | 181,056 | 459 |
| ffn_swiglu | 9.901 | 2.49% | 228,800 | 415 |
| num_loops_2 | 9.908 | 6.94% | 154,880 | 407 |
| fixed_softmax_ssmax_bitnet | 9.936 | 2.60% | 209,864 | 335 |
| bitnet_conv | 10.016 | 2.60% | 209,856 | 305 |
| bitnet_on | 10.016 | 2.60% | 209,856 | 335 |
| mhc | 10.186 | 1.79% | 254,092 | 385 |
| bitnet_routers | 10.327 | — | 247,104 | 330 |
| ssmax | 10.359 | 9.54% | 210,760 | 512 |
| ffn_relu | 10.393 | 3.83% | 210,752 | 369 |
| fixed_both | 10.401 | 7.76% | 210,752 | 431 |
| embedding_conv | 10.401 | 7.76% | 210,752 | 405 |
| fixed_ce | 10.401 | 7.76% | 210,752 | 392 |
| pos_rope | 10.401 | 7.76% | 210,752 | 439 |
| fixed_softmax | 10.401 | 7.76% | 210,752 | 408 |
| residuals_full_attn | 10.433 | 9.54% | 210,944 | 342 |
| residuals_none | 10.476 | 5.71% | 210,752 | 389 |
| moe | 10.477 | — | 248,384 | 373 |
| residuals_block_attn | 10.487 | 1.79% | 210,944 | 363 |
| mod | 10.854 | — | 210,944 | 383 |
| Conmutador | Pérdida final | Top-1 | Parámetros | tok/s |
|---|---|---|---|---|
| factorized_emb | 9.623 | 1.43% | 181,056 | 459 |
| ffn_swiglu | 9.901 | 2.49% | 228,800 | 415 |
| num_loops_2 | 9.908 | 6.94% | 154,880 | 407 |
| fixed_softmax_ssmax_bitnet | 9.936 | 2.60% | 209,864 | 335 |
| bitnet_conv | 10.016 | 2.60% | 209,856 | 305 |
| bitnet_on | 10.016 | 2.60% | 209,856 | 335 |
| mhc | 10.186 | 1.79% | 254,092 | 385 |
| bitnet_routers | 10.327 | — | 247,104 | 330 |
| ssmax | 10.359 | 9.54% | 210,760 | 512 |
| ffn_relu | 10.393 | 3.83% | 210,752 | 369 |
| fixed_both | 10.401 | 7.76% | 210,752 | 431 |
| embedding_conv | 10.401 | 7.76% | 210,752 | 405 |
| fixed_ce | 10.401 | 7.76% | 210,752 | 392 |
| pos_rope | 10.401 | 7.76% | 210,752 | 439 |
| fixed_softmax | 10.401 | 7.76% | 210,752 | 408 |
| residuals_full_attn | 10.433 | 9.54% | 210,944 | 342 |
| residuals_none | 10.476 | 5.71% | 210,752 | 389 |
| moe | 10.477 | — | 248,384 | 373 |
| residuals_block_attn | 10.487 | 1.79% | 210,944 | 363 |
| mod | 10.854 | — | 210,944 | 383 |
6 · Deployment and inference6 · Despliegue e inferencia
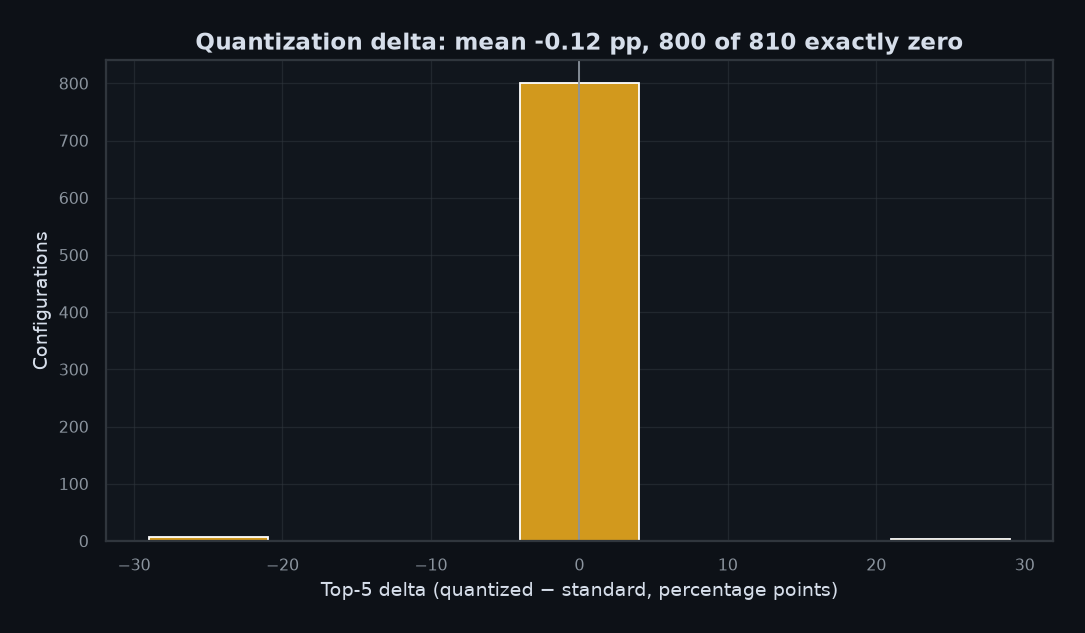
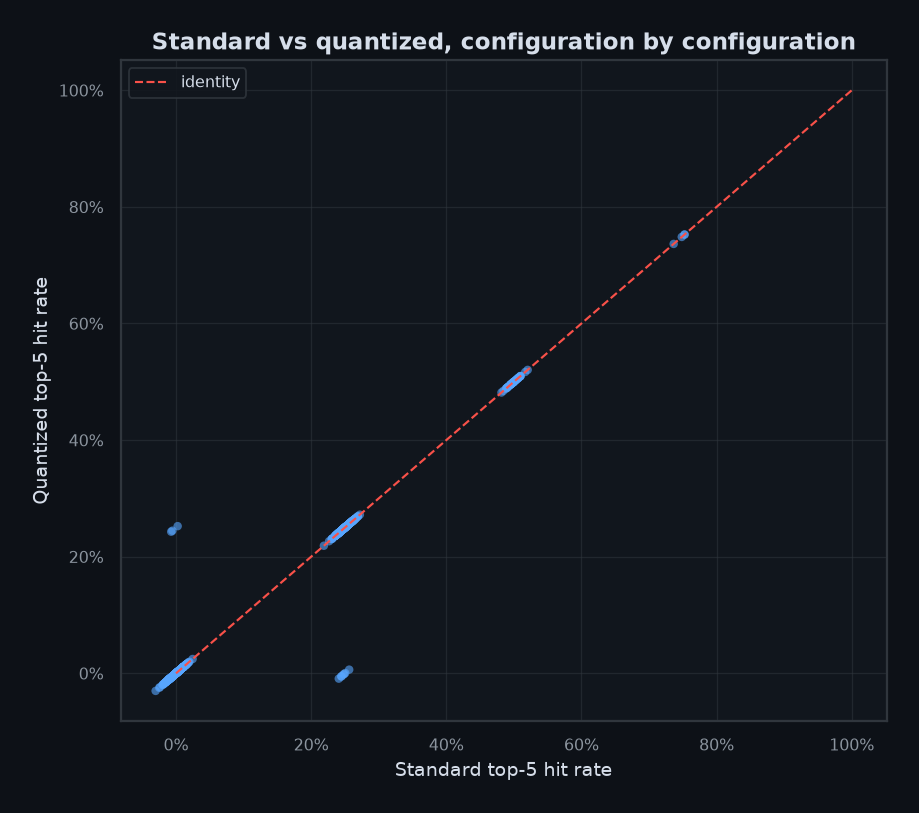
Post-training quantization is the good news of the round. Across the 810 configurations with both formats, mean top-1 moves from 5.62% to 5.43% and mean top-5 from 13.36% to 13.24% — deltas of -0.19 and -0.12 percentage points. 800 configurations are exactly unchanged; the few that move do so by one sample out of four. For a smoke-scale model this is the expected result, but it is worth having it measured rather than assumed.La cuantización post-entrenamiento es la buena noticia de la tanda. En las 810 configuraciones con ambos formatos, el top-1 medio pasa de 5,62 % a 5,43 % y el top-5 medio de 13,36 % a 13,24 % — deltas de -0,19 y -0,12 puntos porcentuales. 800 configuraciones quedan exactamente iguales; las pocas que se mueven lo hacen por una muestra de cuatro. Para un modelo a escala de humo es el resultado esperado, pero vale la pena medirlo en vez de asumirlo.
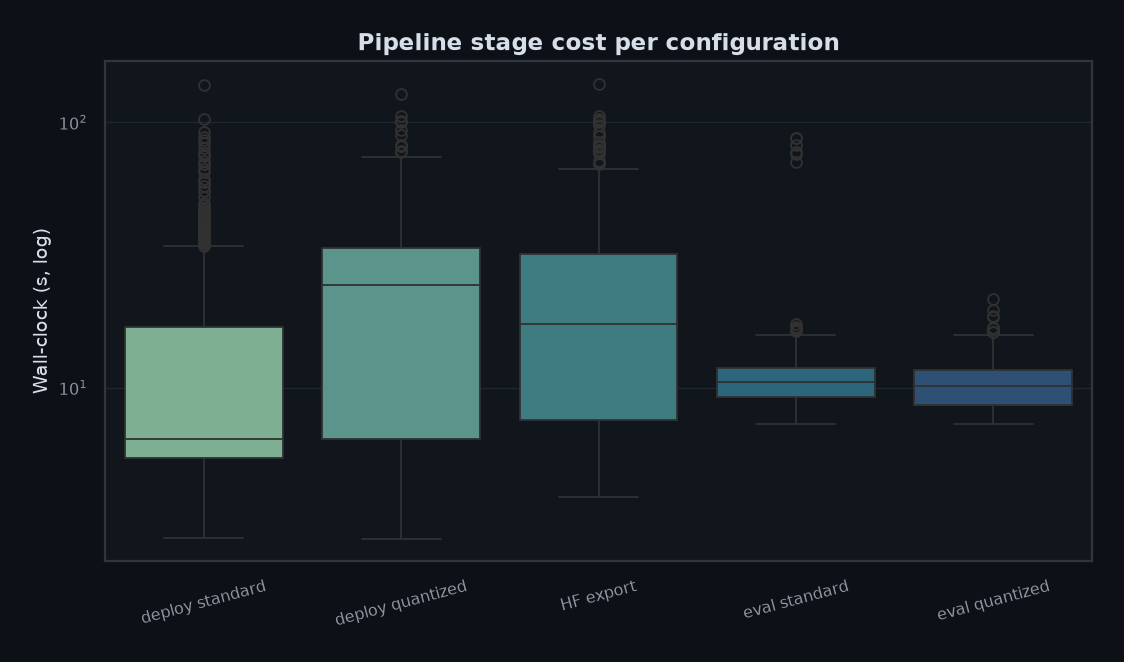
The speed story is less flattering. Quantized deployment is faster than standard deployment in only 32.3% of runs (median ratio 0.64×) because the deploy stage is dominated by serialization and conversion, not by inference; evaluation is faster 51.2% of the time with a median 1.03× speed-up. Inference itself takes about 10.5 s for four sentences, which is the metric that actually matters at serving time.La historia de velocidad es menos halagüeña. El despliegue cuantizado es más rápido que el estándar solo en 32,3 % de las corridas (ratio mediano 0,64×) porque la etapa de despliegue está dominada por la serialización y la conversión, no por la inferencia; la evaluación es más rápida 51,2 % de las veces con una aceleración mediana de 1,03×. La inferencia en sí tarda unos 10,5 s para cuatro frases, que es la métrica que de verdad importa en producción.
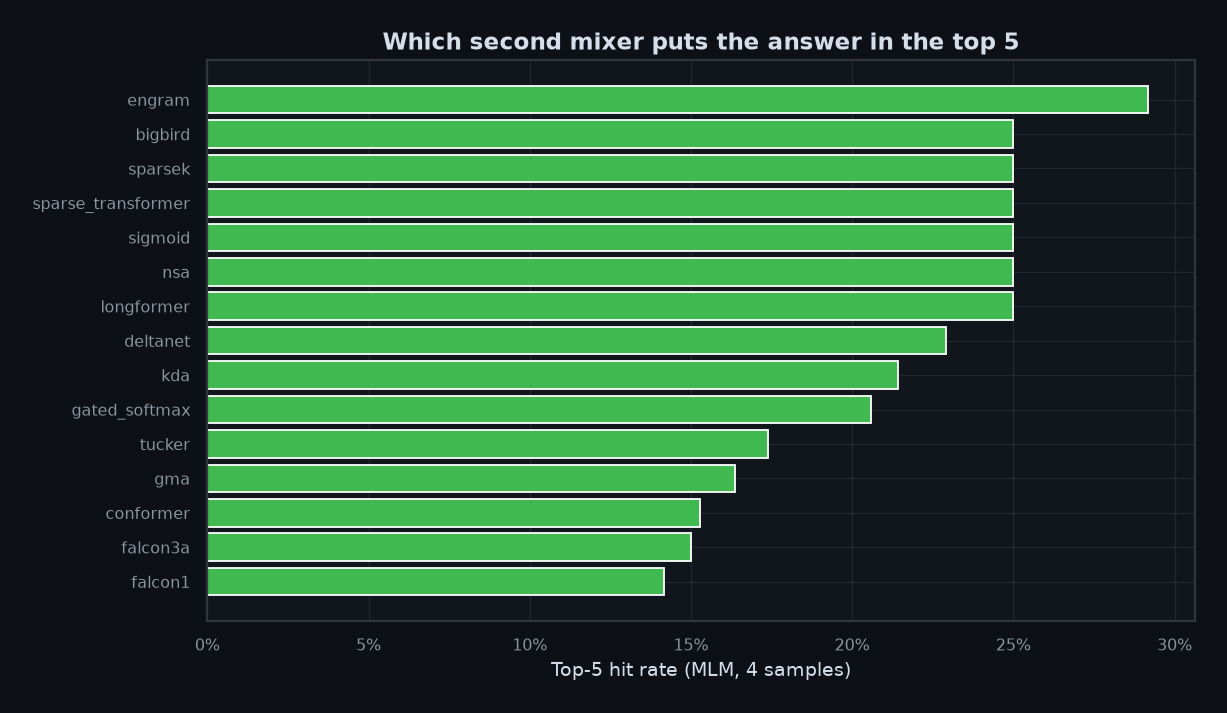
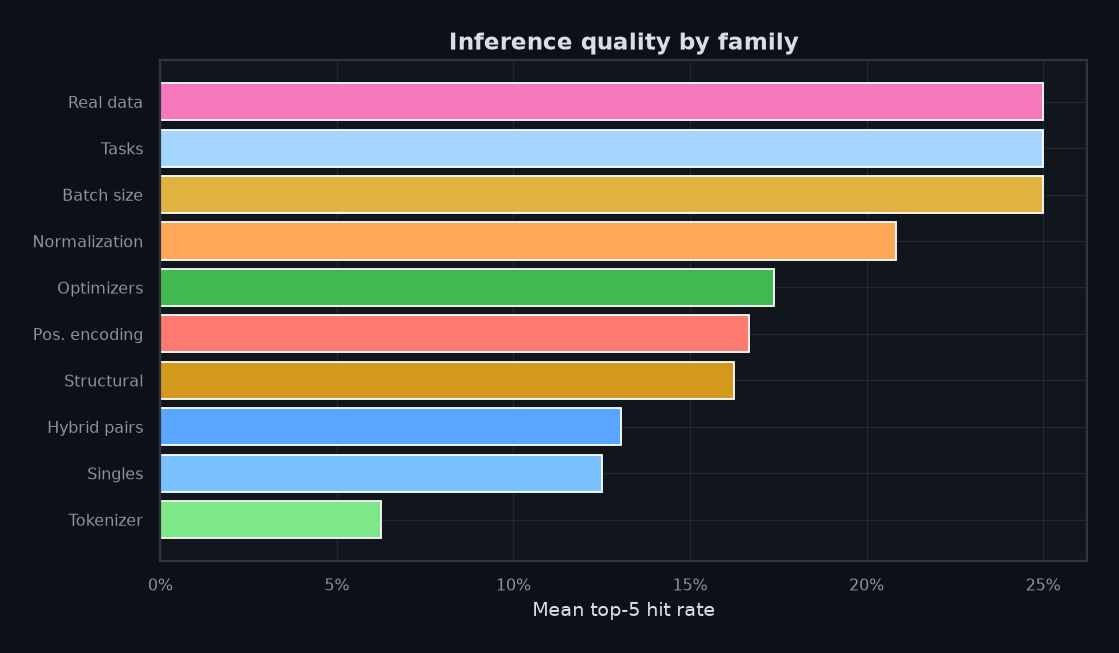
mamba__engram_attn hits 3 of 4 tokens in the top-5 (75.0%), yet its training loss (10.28) is above the pair median. With four samples per configuration, top-5 is a blunt instrument: use it to catch catastrophic failures, not to crown a winner.mamba__engram_attn acierta 3 de 4 tokens en el top-5 (75,0 %), pero su pérdida de entrenamiento (10,28) está por encima de la mediana de los pares. Con cuatro muestras por configuración, el top-5 es un instrumento romo: sirve para detectar fallos catastróficos, no para coronar un ganador.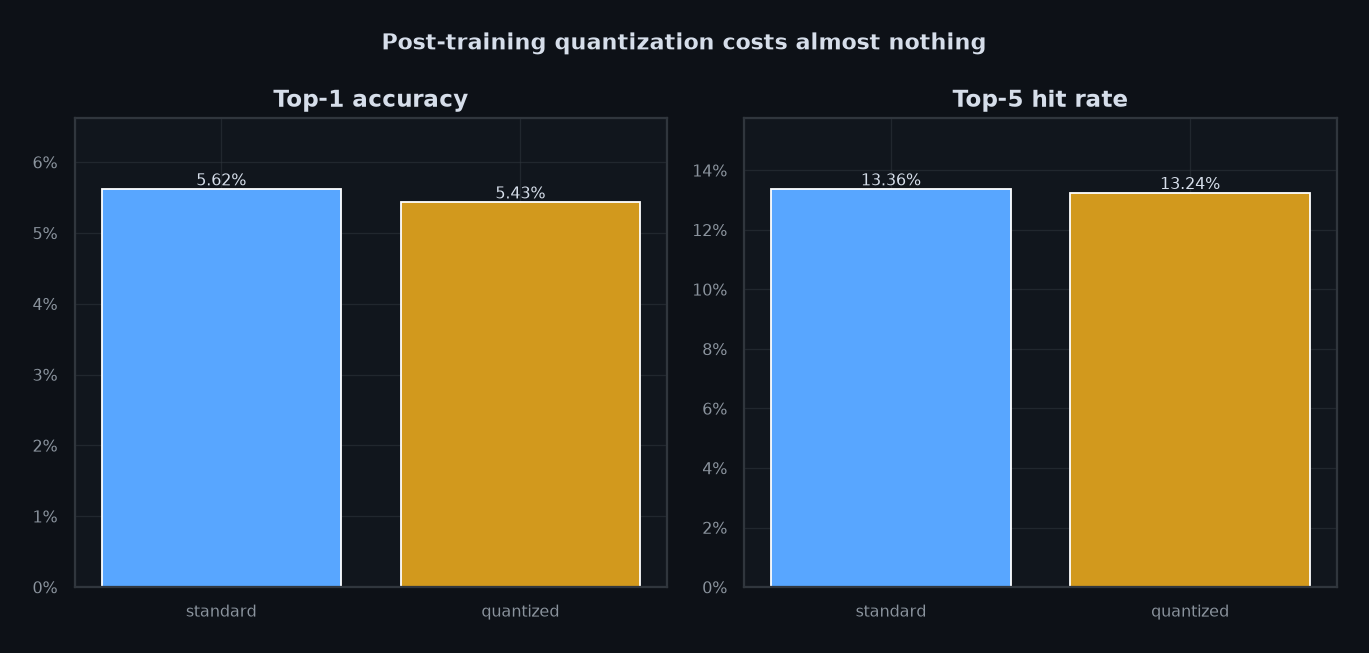
Best inference configurationsMejores configuraciones de inferencia
| Configuration | Top-5 std | Top-1 std | Top-5 quant | Final loss | Top-1 | Params |
|---|---|---|---|---|---|---|
| mamba__engram_attn | 75% | 50% | 75% | 10.277 | 1.10% | 347,168 |
| mamba__nsa_attn | 75% | 0% | 75% | 9.262 | 5.22% | 192,479 |
| retnet__fox_attn | 75% | 0% | 75% | 9.873 | 8.50% | 220,936 |
| retnet__fox_attn | 75% | 0% | 75% | 9.873 | 8.50% | 220,936 |
| bigbird__kda_attn | 50% | 0% | 50% | 10.196 | 6.46% | 221,128 |
| fox__engram_attn | 50% | 25% | 50% | 9.535 | 2.38% | 375,496 |
| fox__gated_softmax_attn | 50% | 25% | 50% | 9.892 | 8.50% | 220,744 |
| fox__tucker_attn | 50% | 25% | 50% | 9.890 | 8.50% | 220,744 |
| gated_deltanet__tucker_attn | 50% | 25% | 50% | 9.796 | 7.68% | 230,928 |
| gated_softmax__falcon1_attn | 50% | 25% | 50% | 9.852 | 0.00% | 222,672 |
| gated_softmax__falcon3_attn | 50% | 25% | 50% | 9.866 | 0.00% | 222,672 |
| gla__falcon1_attn | 50% | 0% | 50% | 9.511 | 7.40% | 226,032 |
| gla__falcon3_attn | 50% | 0% | 50% | 9.526 | 7.40% | 226,032 |
| gla__mlra_attn | 50% | 25% | 50% | 9.538 | 6.84% | 211,808 |
| gla__mtla_attn | 50% | 50% | 50% | 9.759 | 2.04% | 221,072 |
| Configuración | Top-5 estándar | Top-1 estándar | Top-5 cuant. | Pérdida final | Top-1 | Parámetros |
|---|---|---|---|---|---|---|
| mamba__engram_attn | 75% | 50% | 75% | 10.277 | 1.10% | 347,168 |
| mamba__nsa_attn | 75% | 0% | 75% | 9.262 | 5.22% | 192,479 |
| retnet__fox_attn | 75% | 0% | 75% | 9.873 | 8.50% | 220,936 |
| retnet__fox_attn | 75% | 0% | 75% | 9.873 | 8.50% | 220,936 |
| bigbird__kda_attn | 50% | 0% | 50% | 10.196 | 6.46% | 221,128 |
| fox__engram_attn | 50% | 25% | 50% | 9.535 | 2.38% | 375,496 |
| fox__gated_softmax_attn | 50% | 25% | 50% | 9.892 | 8.50% | 220,744 |
| fox__tucker_attn | 50% | 25% | 50% | 9.890 | 8.50% | 220,744 |
| gated_deltanet__tucker_attn | 50% | 25% | 50% | 9.796 | 7.68% | 230,928 |
| gated_softmax__falcon1_attn | 50% | 25% | 50% | 9.852 | 0.00% | 222,672 |
| gated_softmax__falcon3_attn | 50% | 25% | 50% | 9.866 | 0.00% | 222,672 |
| gla__falcon1_attn | 50% | 0% | 50% | 9.511 | 7.40% | 226,032 |
| gla__falcon3_attn | 50% | 0% | 50% | 9.526 | 7.40% | 226,032 |
| gla__mlra_attn | 50% | 25% | 50% | 9.538 | 6.84% | 211,808 |
| gla__mtla_attn | 50% | 50% | 50% | 9.759 | 2.04% | 221,072 |
7 · Reliability of the pipeline7 · Fiabilidad del pipeline
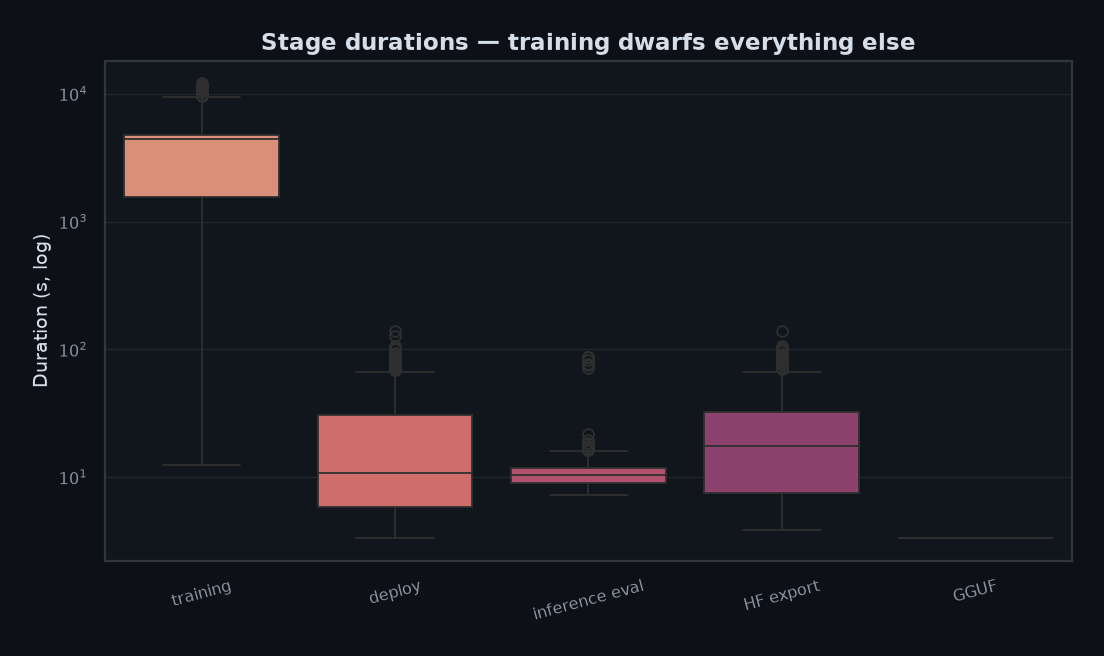
The pipeline ledger records 5,271 stage executions. 868 training runs succeeded and 171 failed with a non-zero exit code (all of them outside the 868 analysed configurations, which were selected precisely because they trained). Deployment failed 104 times out of 1,734, always in symmetric pairs — a configuration that fails the standard export also fails the quantized one, which points to a shared root cause (checkpoint or config serialization) rather than to quantization itself.El libro del pipeline registra 5.271 ejecuciones de etapas. 868 entrenamientos tuvieron éxito y 171 fallaron con código de salida distinto de cero (todos fuera de las 868 configuraciones analizadas, que se eligieron justamente porque entrenaron). El despliegue falló 104 veces de 1.734, siempre en pares simétricos — una configuración que falla el export estándar también falla el cuantizado, lo que apunta a una causa raíz compartida (serialización del checkpoint o de la config) y no a la cuantización en sí.
Two data-quality findings matter for interpretation. First, four mixers never train: cca, ccgqa, msa and ssog fail in their 4 singles and in all 158 pairs that contain them (4×41 − C(4,2) = 158), which is exactly the 158 missing cells of the atlas. Second, four mixers are indistinguishable at 32-token context: std/bigbird/longformer/titan share bit-identical losses and parameter counts because their windows (≥64 tokens) cover the whole sequence and the PE-augmented variant reduces to plain MHA. Separately, 37 pairs appear as attn_retnet__X and attn_retnet_attn__X with identical metrics — two names for the same implementation, which the atlas collapses to one.Dos hallazgos de calidad de datos condicionan la interpretación. Primero, cuatro mixers nunca entrenan: cca, ccgqa, msa y ssog fallan en sus 4 singles y en los 158 pares que los contienen (4×41 − C(4,2) = 158), exactamente las 158 celdas ausentes del atlas. Segundo, cuatro mixers son indistinguibles con contexto de 32 tokens: std/bigbird/longformer/titan comparten pérdidas y parámetros bit a bit idénticos porque sus ventanas (≥64 tokens) cubren toda la secuencia y la variante con codificación posicional se reduce a MHA pura. Por separado, 37 pares aparecen como attn_retnet__X y attn_retnet_attn__X con métricas idénticas — dos nombres para la misma implementación, que el atlas colapsa a uno.
Stage ledgerLibro de etapas
| Stage | Records | OK | Failed | Median (s) | P90 (s) | Total (h) |
|---|---|---|---|---|---|---|
| training | 1,039 | 868 | 171 | 4,101.45 | 5,037.3 | 906.0 |
| transformers-export | 867 | 867 | 0 | 17.41 | 44.7 | 5.4 |
| inference-eval | 1,630 | 1,630 | 0 | 10.37 | 13.1 | 4.9 |
| deploy | 1,734 | 1,630 | 104 | 8.64 | 38.0 | 8.8 |
| bitnet-gguf | 1 | 1 | 0 | 3.32 | 3.3 | 0.0 |
| Etapa | Registros | OK | Fallos | Mediana (s) | P90 (s) | Total (h) |
|---|---|---|---|---|---|---|
| training | 1,039 | 868 | 171 | 4,101.45 | 5,037.3 | 906.0 |
| transformers-export | 867 | 867 | 0 | 17.41 | 44.7 | 5.4 |
| inference-eval | 1,630 | 1,630 | 0 | 10.37 | 13.1 | 4.9 |
| deploy | 1,734 | 1,630 | 104 | 8.64 | 38.0 | 8.8 |
| bitnet-gguf | 1 | 1 | 0 | 3.32 | 3.3 | 0.0 |
8 · What actually predicts quality8 · Qué predice de verdad la calidad
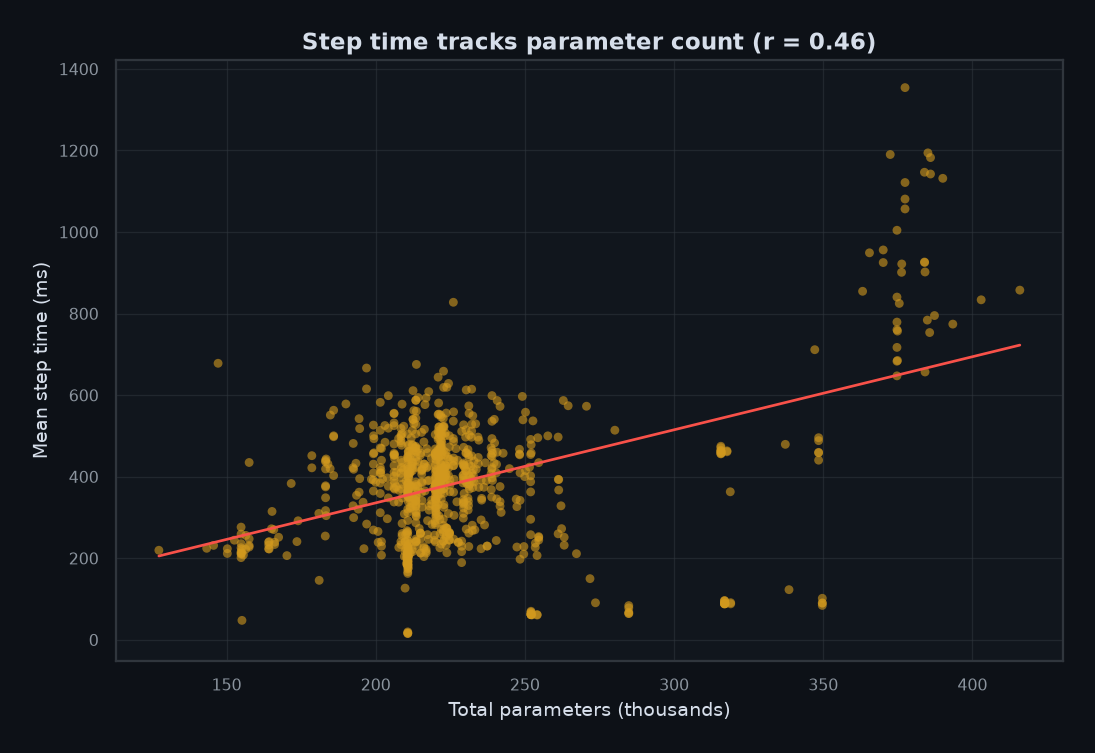
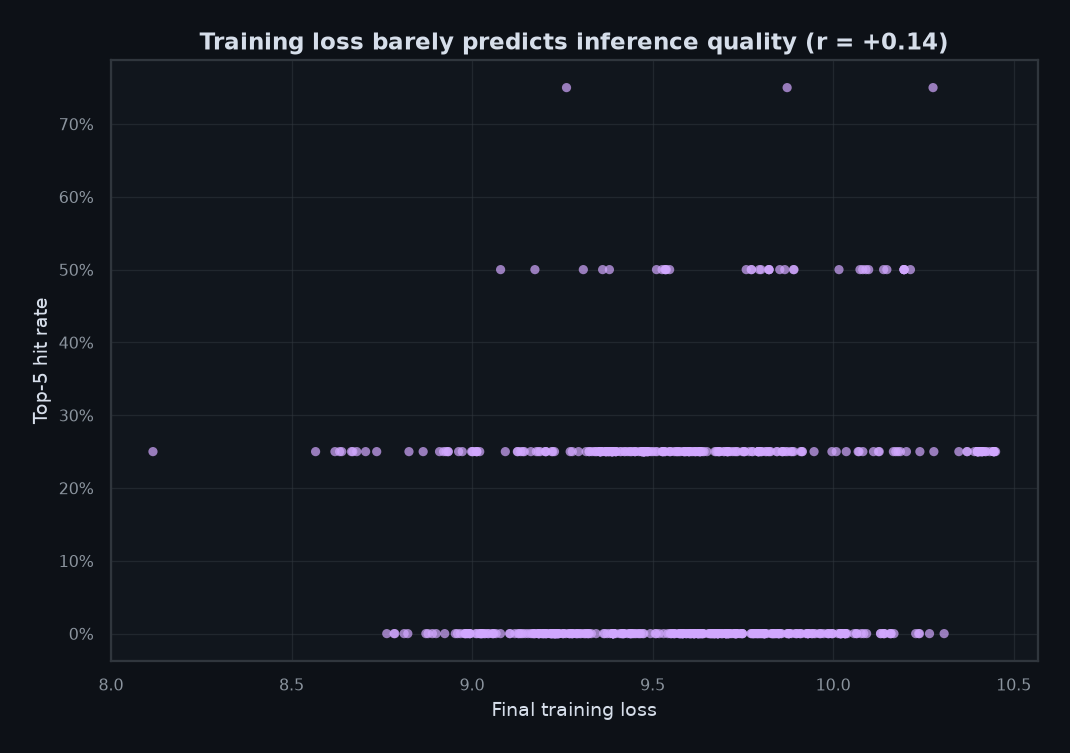
The correlation matrix answers the question everybody asks first: does size buy quality here? Barely. Parameter count correlates -0.19 with final loss and -0.07 with held-out accuracy. What parameter count does predict reliably is cost: r = 0.46 with step time and r = 0.65 with total training time. Training loss carries only a weak signal about inference quality (r = 0.14 with top-5), while gradient norm and clip ratio are almost perfectly redundant with each other and uncorrelated with quality.La matriz de correlación responde la primera pregunta de todos: ¿el tamaño compra calidad aquí? Apenas. El número de parámetros correlaciona -0,19 con la pérdida final y -0,07 con la precisión de validación. Lo que sí predice de forma fiable es el coste: r = 0,46 con el tiempo por paso y r = 0,65 con el tiempo total de entrenamiento. La pérdida de entrenamiento apenas informa sobre la calidad de inferencia (r = 0,14 con el top-5), mientras que la norma de gradiente y la razón de recorte son casi perfectamente redundantes entre sí y no correlacionan con la calidad.
engram, sparsek, mlra) and a cheap, stable first mixer (fox, gqa, gated_deltanet2). Avoid mamba, retnet and bigbird as B. Expect ±0.3 nats of interaction noise, which is larger than the difference between most optimizers.engram, sparsek, mlra) y un primer mixer barato y estable (fox, gqa, gated_deltanet2). Evita mamba, retnet y bigbird como B. Espera ±0,3 nats de ruido de interacción, mayor que la diferencia entre la mayoría de los optimizadores.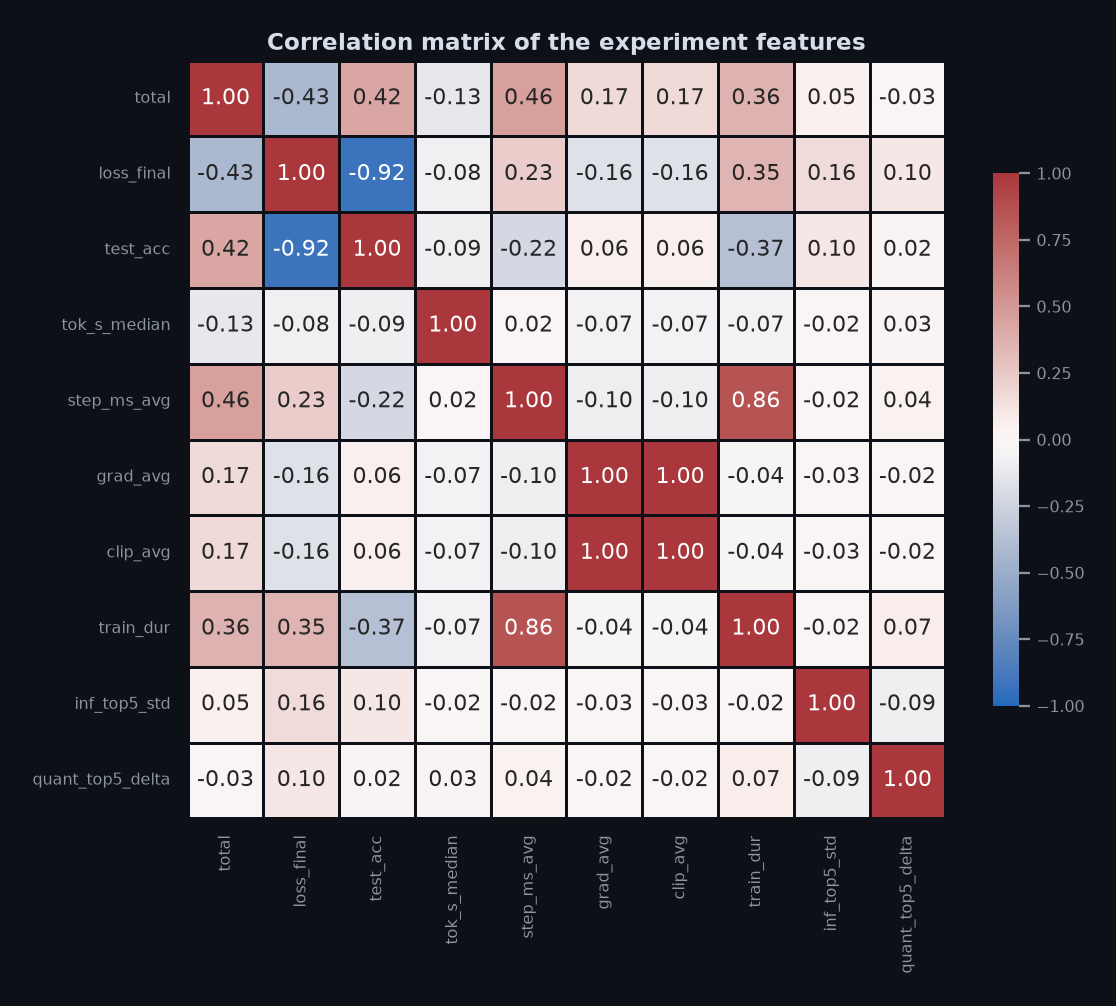
9 · Conclusions and next steps9 · Conclusiones y próximos pasos
Choose B first: it moves loss by 0.81 nats across its range versus 0.55 for A (1.5× wider). Re-run the grid with the top-5 B candidates and full coverage over A before spending GPU time on optimizers.Elige B primero: mueve la pérdida 0,81 nats en su rango frente a 0,55 de A (1,5× más ancho). Repite la rejilla con los cinco mejores B y cobertura completa sobre A antes de gastar GPU en optimizadores.
At 32 tokens, BigBird/Longformer windows cover the whole sequence and titan reduces to plain MHA, so four mixers measure the same thing. Re-run the atlas at 256–512 tokens, and drop the retnet/retnet_attn duplicate from the mixer list.Con 32 tokens, las ventanas de BigBird/Longformer cubren toda la secuencia y titan se reduce a MHA pura, así que cuatro mixers miden lo mismo. Repite el atlas con 256–512 tokens y elimina el duplicado retnet/retnet_attn de la lista de mixers.
Quantization cost 0.12 pp of top-5 on average and sped up evaluation in 51.2% of runs, so it should be the default deployment format.La cuantización costó 0,12 pp de top-5 de media y aceleró la evaluación en 51,2 % de las corridas, así que debería ser el formato de despliegue por defecto.
The inference signal is too noisy to rank 800 configurations. A 200-sentence held-out set with per-token log-likelihood would turn the top-5 chart into a usable ranking.La señal de inferencia tiene demasiado ruido para ordenar 800 configuraciones. Un conjunto reservado de 200 frases con log-verosimilitud por token convertiría el gráfico de top-5 en un ranking utilizable.
Every curve is still descending at epoch 100. Extend the top-20 pairs to 300 epochs before drawing conclusions about architecture quality; today the ranking rewards fast learners.Todas las curvas siguen bajando en la época 100. Extiende los 20 mejores pares a 300 épocas antes de concluir sobre calidad arquitectónica; hoy el ranking premia a los que aprenden rápido.
10 · Data, figures and reproducibility10 · Datos, figuras y reproducibilidad
Every file below is published as a static asset next to this page. The 868 raw per-run CSVs (one per configuration, 3,001 steps each) live in data/raw/; they are the source of the aggregated per-epoch table and of every chart in this report. Example: attn_nsa_attn__engram_attn.csv.Todos los archivos siguientes se publican como activos estáticos junto a esta página. Los 868 registros crudos por corrida (uno por configuración, 3.001 pasos cada uno) están en data/raw/ como CSV comprimidos con gzip; son la fuente de la tabla agregada por época y de todos los gráficos de este informe. Descomprime con gunzip archivo.csv.gz. Ejemplo: attn_nsa_attn__engram_attn.csv.gz.
| FileArchivo | ContentsContenido |
|---|---|
| master.csv | One row per configuration: parameters, training, pipeline and inference metrics joined.Una fila por configuración: parámetros, entrenamiento, pipeline e inferencia unidos. |
| training_per_epoch.csv | Per-run, per-epoch means of loss, accuracy, LR, grad norms and throughput (2.66 M steps → 86,274 rows).Medias por corrida y época de pérdida, precisión, LR, normas de gradiente y rendimiento (2,66 M de pasos → 86.274 filas). |
| inference_samples.csv | Every inference record: 4 samples × 2 formats × 815 configurations.Cada registro de inferencia: 4 muestras × 2 formatos × 815 configuraciones. |
| pipeline_stages.csv | The full 5,271-row ledger of training, deploy, eval and export stages.El libro completo de 5.271 filas de las etapas de entrenamiento, despliegue, evaluación y export. |
| param_metrics.csv | Raw parameter census by module group.Censo crudo de parámetros por grupo de módulos. |
| training_metrics_avg.csv | Raw per-run averages of all 34 logged metrics.Promedios crudos por corrida de las 34 métricas registradas. |
| training_metrics_final.csv | Raw last-step snapshot of every run.Instantánea cruda del último paso de cada corrida. |
| training_metrics_std.csv | Raw per-run standard deviations.Desviaciones estándar crudas por corrida. |
| results.md.csv | Human-readable results digest.Resumen legible de resultados. |
Rebuild: uv run --with pandas --with numpy --with matplotlib --with seaborn python experimentos/2/report/build_data.py && python make_charts.py && python make_report.py. The whole pipeline reads 702 MB of per-step logs in chunks and never needs a GPU.Reconstruir: uv run --with pandas --with numpy --with matplotlib --with seaborn python experimentos/2/report/build_data.py && python make_charts.py && python make_report.py. Todo el pipeline lee 702 MB de logs paso a paso por bloques y nunca necesita GPU.
Build your own viewConstruye tu propia vista
The chart maker is a Tableau-style builder wired to the same datasets: drag fields into Columns, Rows, Color and Size, pick one of fourteen chart types and save your views in the browser.El constructor de gráficos es un generador estilo Tableau conectado a los mismos datasets: arrastra campos a Columnas, Filas, Color y Tamaño, elige uno de catorce tipos de gráfico y guarda tus vistas en el navegador.
Open the chart makerAbrir el constructor →